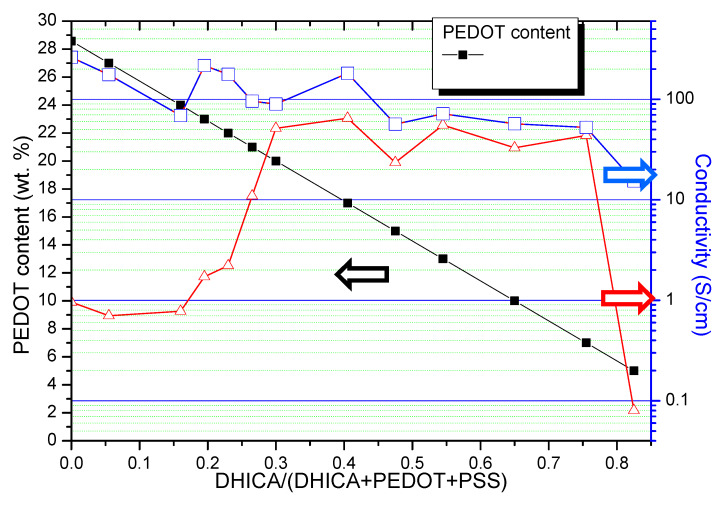
Figure 2.
The electrical conductivity of the films featuring various DHICA contents (DHICA weight fractions DHICA/(PEDOT + PSS + DHICA): 0, 0.055, 0.160, 0.195, 0.230, 0.265, 0.300, 0.405, 0.475, 0.545, 0.650, 0.755, 0.825). Data were measured before (triangle) and after (open square) DMSO treatment. The black full squares indicates the content of the PEDOT respect to all the components of the film, that is, proportional to PEDOT/(DHICA + PEDOT + PSS).

