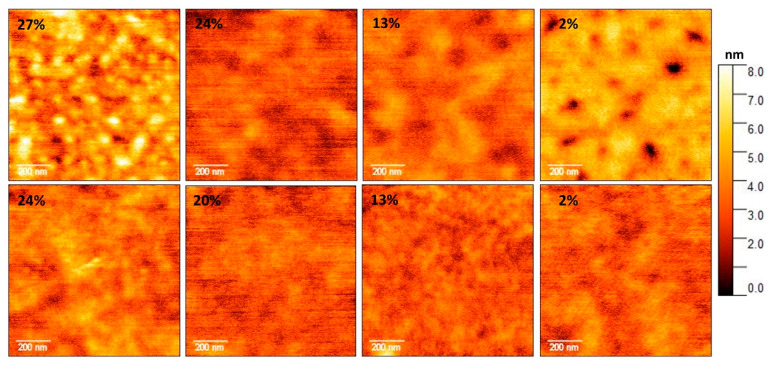
Figure 4.
Atomic force microscopy (AFM) topography of the investigated C-EuPH samples. Top panels refer to the samples not treated with DMSO and bottom panels refer to those prepared in DMSO. The PEDOT weight percent is reported in the top-left corner of each image, DHICA weight percent is as follows: PEDOT 27%–DHICA 6%; PEDOT 24%–DHICA 16%; PEDOT 20%–DHICA 30%; and PEDOT 2%–DHICA 94%, respectively. Scans are 1 µm2 with a resolution of 256 × 256 pixels.

