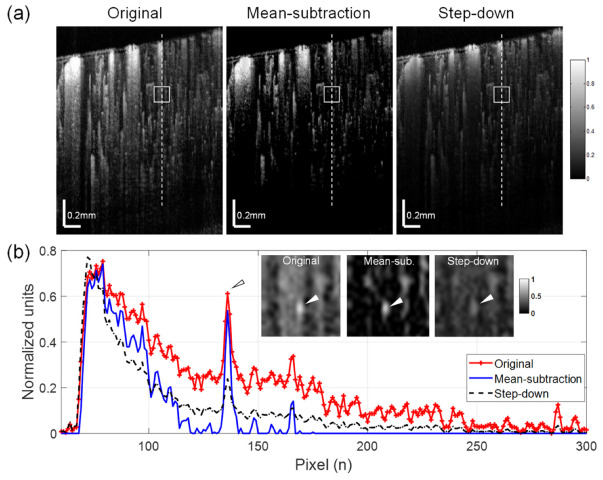
Figure 4.
Comparisons of de-shadowing using the proposed mean-subtraction method and the well-established step-down exponential filtering method. (a) Normalized OCTA cross-sections of mouse cortex: original (left), processed with the mean-subtraction method (middle) and the step-down method (right). (b) Depth profiles taken along the dashed lines in (a) showing largely reduced shadow tails for both methods. However, the mean-subtraction method results in higher signal contrast for a small vessel (arrow head) in the de-shadowed region compared with the original image and the image processed with the step-down approach. Insets in the graph are enlargements of a region indicated as boxes in (a), where the underlying vessel (arrowhead) is brighter and more distinct with the proposed method.

