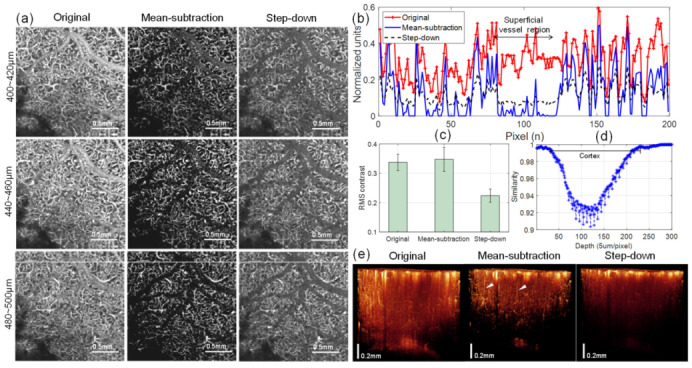
Figure 5.

(a) Comparison of original and de-shadowed en face OCTA images (OCT angiograms) at different depth ranges of the mouse cortex using the proposed mean-subtraction method and the step-down method: (top) 400–420 µm, (middle) 440–460 µm, and (bottom) 480–500 µm below the cortical surface. For all de-shadowed images processed with the mean-subtraction method (second column in (a)), the contrast in vascularized regions is improved and the projections of overlying vessels are removed, as observed from the intensity profiles (b) taken along horizontal lines (white) on the angiograms at the bottom panel of (a). (c) Comparison of root-mean-square (RMS) contrasts calculated from 200 horizontal intensity profiles taken at each angiogram (440–460 μm) of (a). (d) A graph of similarity between angiograms as the cortical depth increases. Lower similarity values indicate less correlation between inner angiograms, representing the structural heterogeneity of capillary vessel networks. (e) 3-D reconstructions of the volumetric OCT angiograms before (left) and after de-shadowing using the mean-subtraction (middle) and step-down methods (right). The penetrating vessels (arrow heads) in the cortex are only noticeable in the image processed with mean subtraction.
