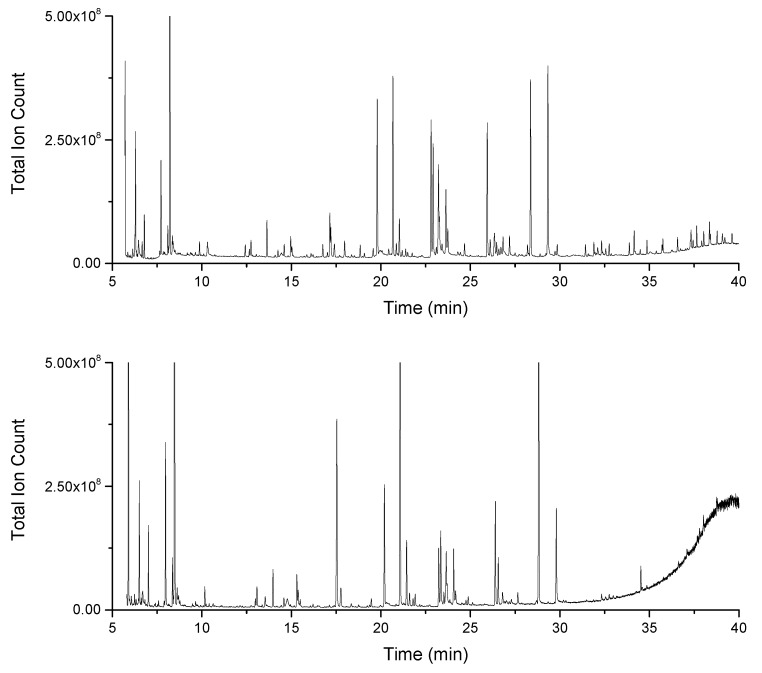
Figure 2.
Chromatograms of pooled samples of the salt stress experiment. Chromatograms show SSkeletonema costatum extracts measured on the ISQ GC–MS (top) and on the Orbitrap GC–MS (bottom). Orbitrap data were recorded with a split ratio of 1:50 and a concentration equivalent to 5 × 10⁴ cells per µL of sample, GC-ISQ data with a split ratio of 1:50 and a concentration equivalent to 4 × 10⁵ cells per µL of sample.

