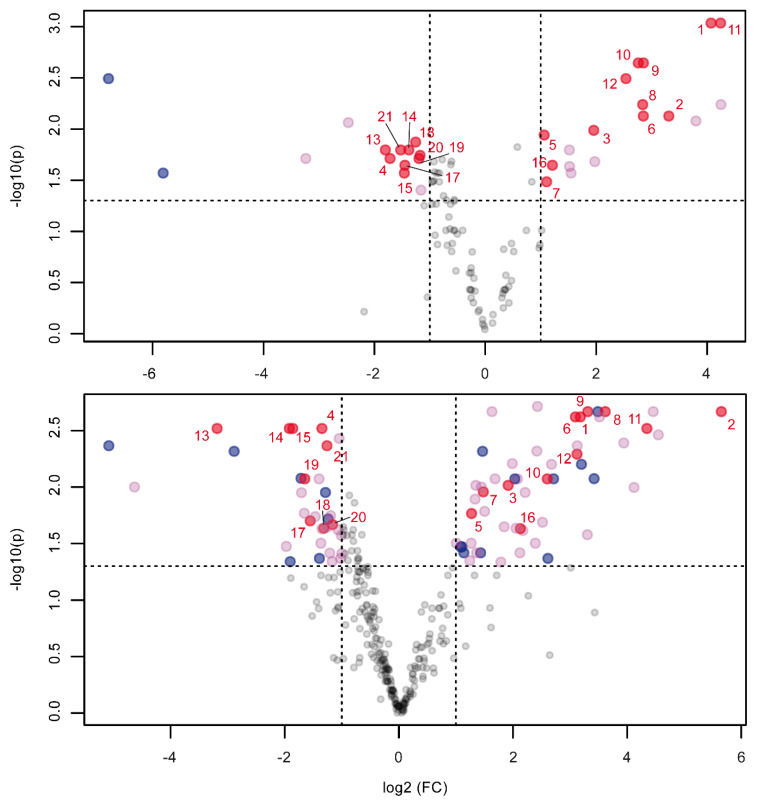
Figure 3.
Volcano plot analysis of the comparative metabolomics experiment on salinity stress of microalgae. Samples were split and measured on both the unit-mass ISQ GC–MS (top) and the high-resolution Orbitrap GC–MS (bottom). Compounds exceeding a fold change (FC) of 2 (peak area from control to stressed) and below a p-value of 0.05 are deemed significantly dysregulated and are plotted in red. Marked in blue are processing artifacts that were not discernible from the background noise upon manual inspection. This left 30 compounds in the ISQ GC–MS and 68 compounds in the Orbitrap GC–MS dataset, respectively. Highlighted in red and numbered are the same compounds found to be significant in both datasets.

