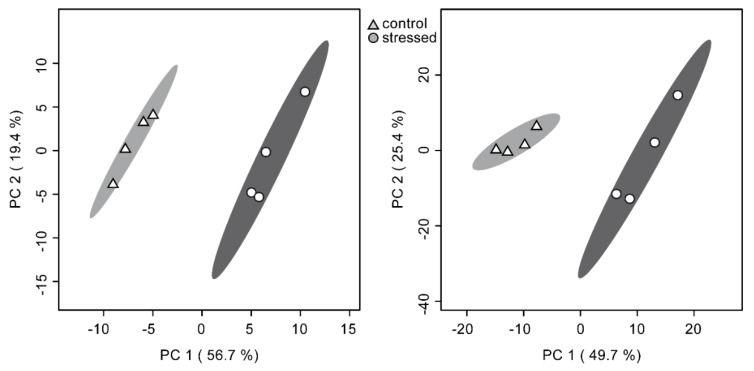
Figure 4.
Principal component analysis (PCA) of the comparative metabolomics experiment with samples split and measured on both the unit-mass ISQ GC–MS (left) and the high-resolution Orbitrap GC–MS (right). Data shown was log transformed and autoscaled. There is no discernible difference between both low- and high-resolution systems concerning the ability to separate samples into experimental groups in this study.

