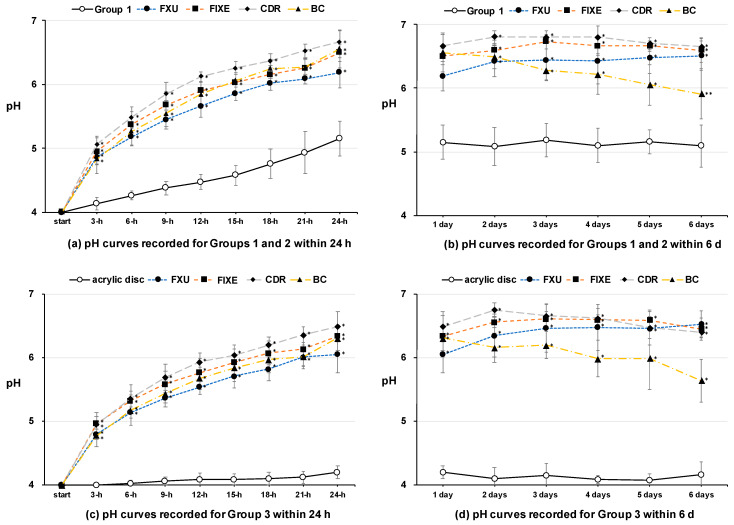
Figure 6.
Variations of the pH values observed for different specimen groups. pH curves recorded for Groups 1 and 2 after incubation for (a) up to 24 h and (b) over a period from 24 h to six days. pH curves recorded for Group 3 after incubation for (c) up to 24 h and (d) over a period from 24 h to six days. Data were statistically analyzed by performing the Kruskal–Wallis test with the Dunn’s multiple comparison post hoc test ((a,b): control = Group 1; (c,d): control = acrylic disc; n = 6, mean ± SD). * p < 0.01, ** p < 0.05.

