Figure 4.

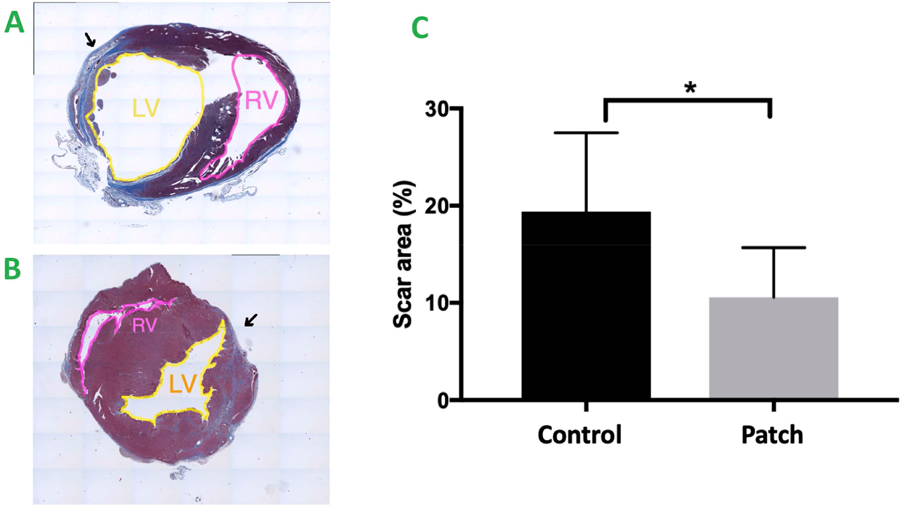
A&B Masson Trichrome staining of the rat heart 4 weeks after surgery. Blue: the area of fibrosis, Red: represents normal myocardium. Yellow: Left Ventricle (LV), Pink: Right Ventricle (RV), Black Arrow: Scar Area.
A. The control group. B. The patch group. C. Statistical analysis of scar area (percentage = infarcted area / total area),* indicates p<0.05. Patch group vs control group (10.6 ± 5.1% vs. 19.39 ± 8.1% (Mean ± SD) respectively, p = 0.048)
