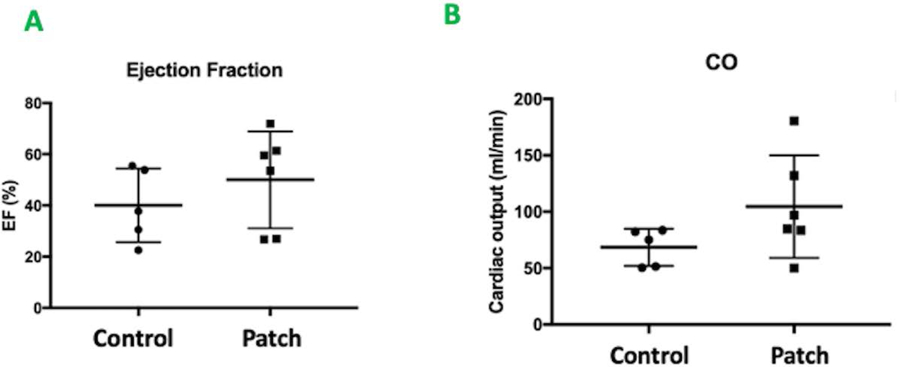
Figure 6.

A&B. Echocardiography performed 4 weeks after implantation. A. Left Ventricular Ejection Fraction. Patch group vs. control group (EF(%): 50.0 ± 18.9 vs. 40.1 ± 14.4, p = 0.36) B. Cardiac Output (ml/min). Patch group vs control group (CO: 104.6 ± 45.5 vs. 68.6 ± 16.4, p =0.1)
