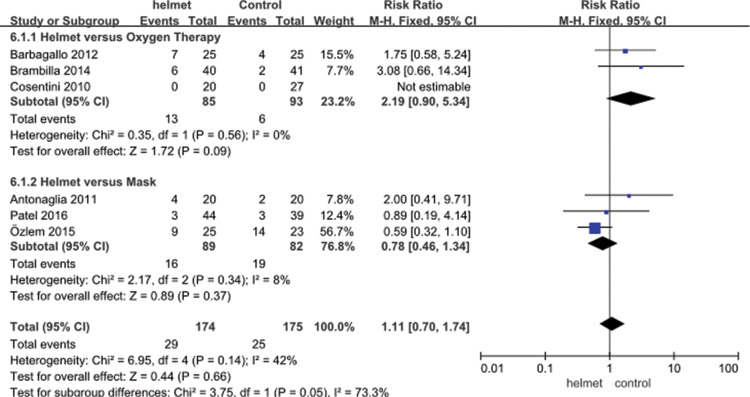
Figure 9.
Effects on complications in patients with respiratory failure in the helmet and control subgroups using a fixed-effects analysis, with a forest plot showing the risk ratio for helmet versus control. Squares and horizontal lines indicate the risk ratio and 95% CIs for each trial; the size of each square is proportional to the statistical weight of the trial in the meta-analysis. Diamonds indicate the estimated effect derived from the meta-analysis, with the centre indicating the point estimate and the left and right points indicating 95% CIs. CI, confidence interval.

