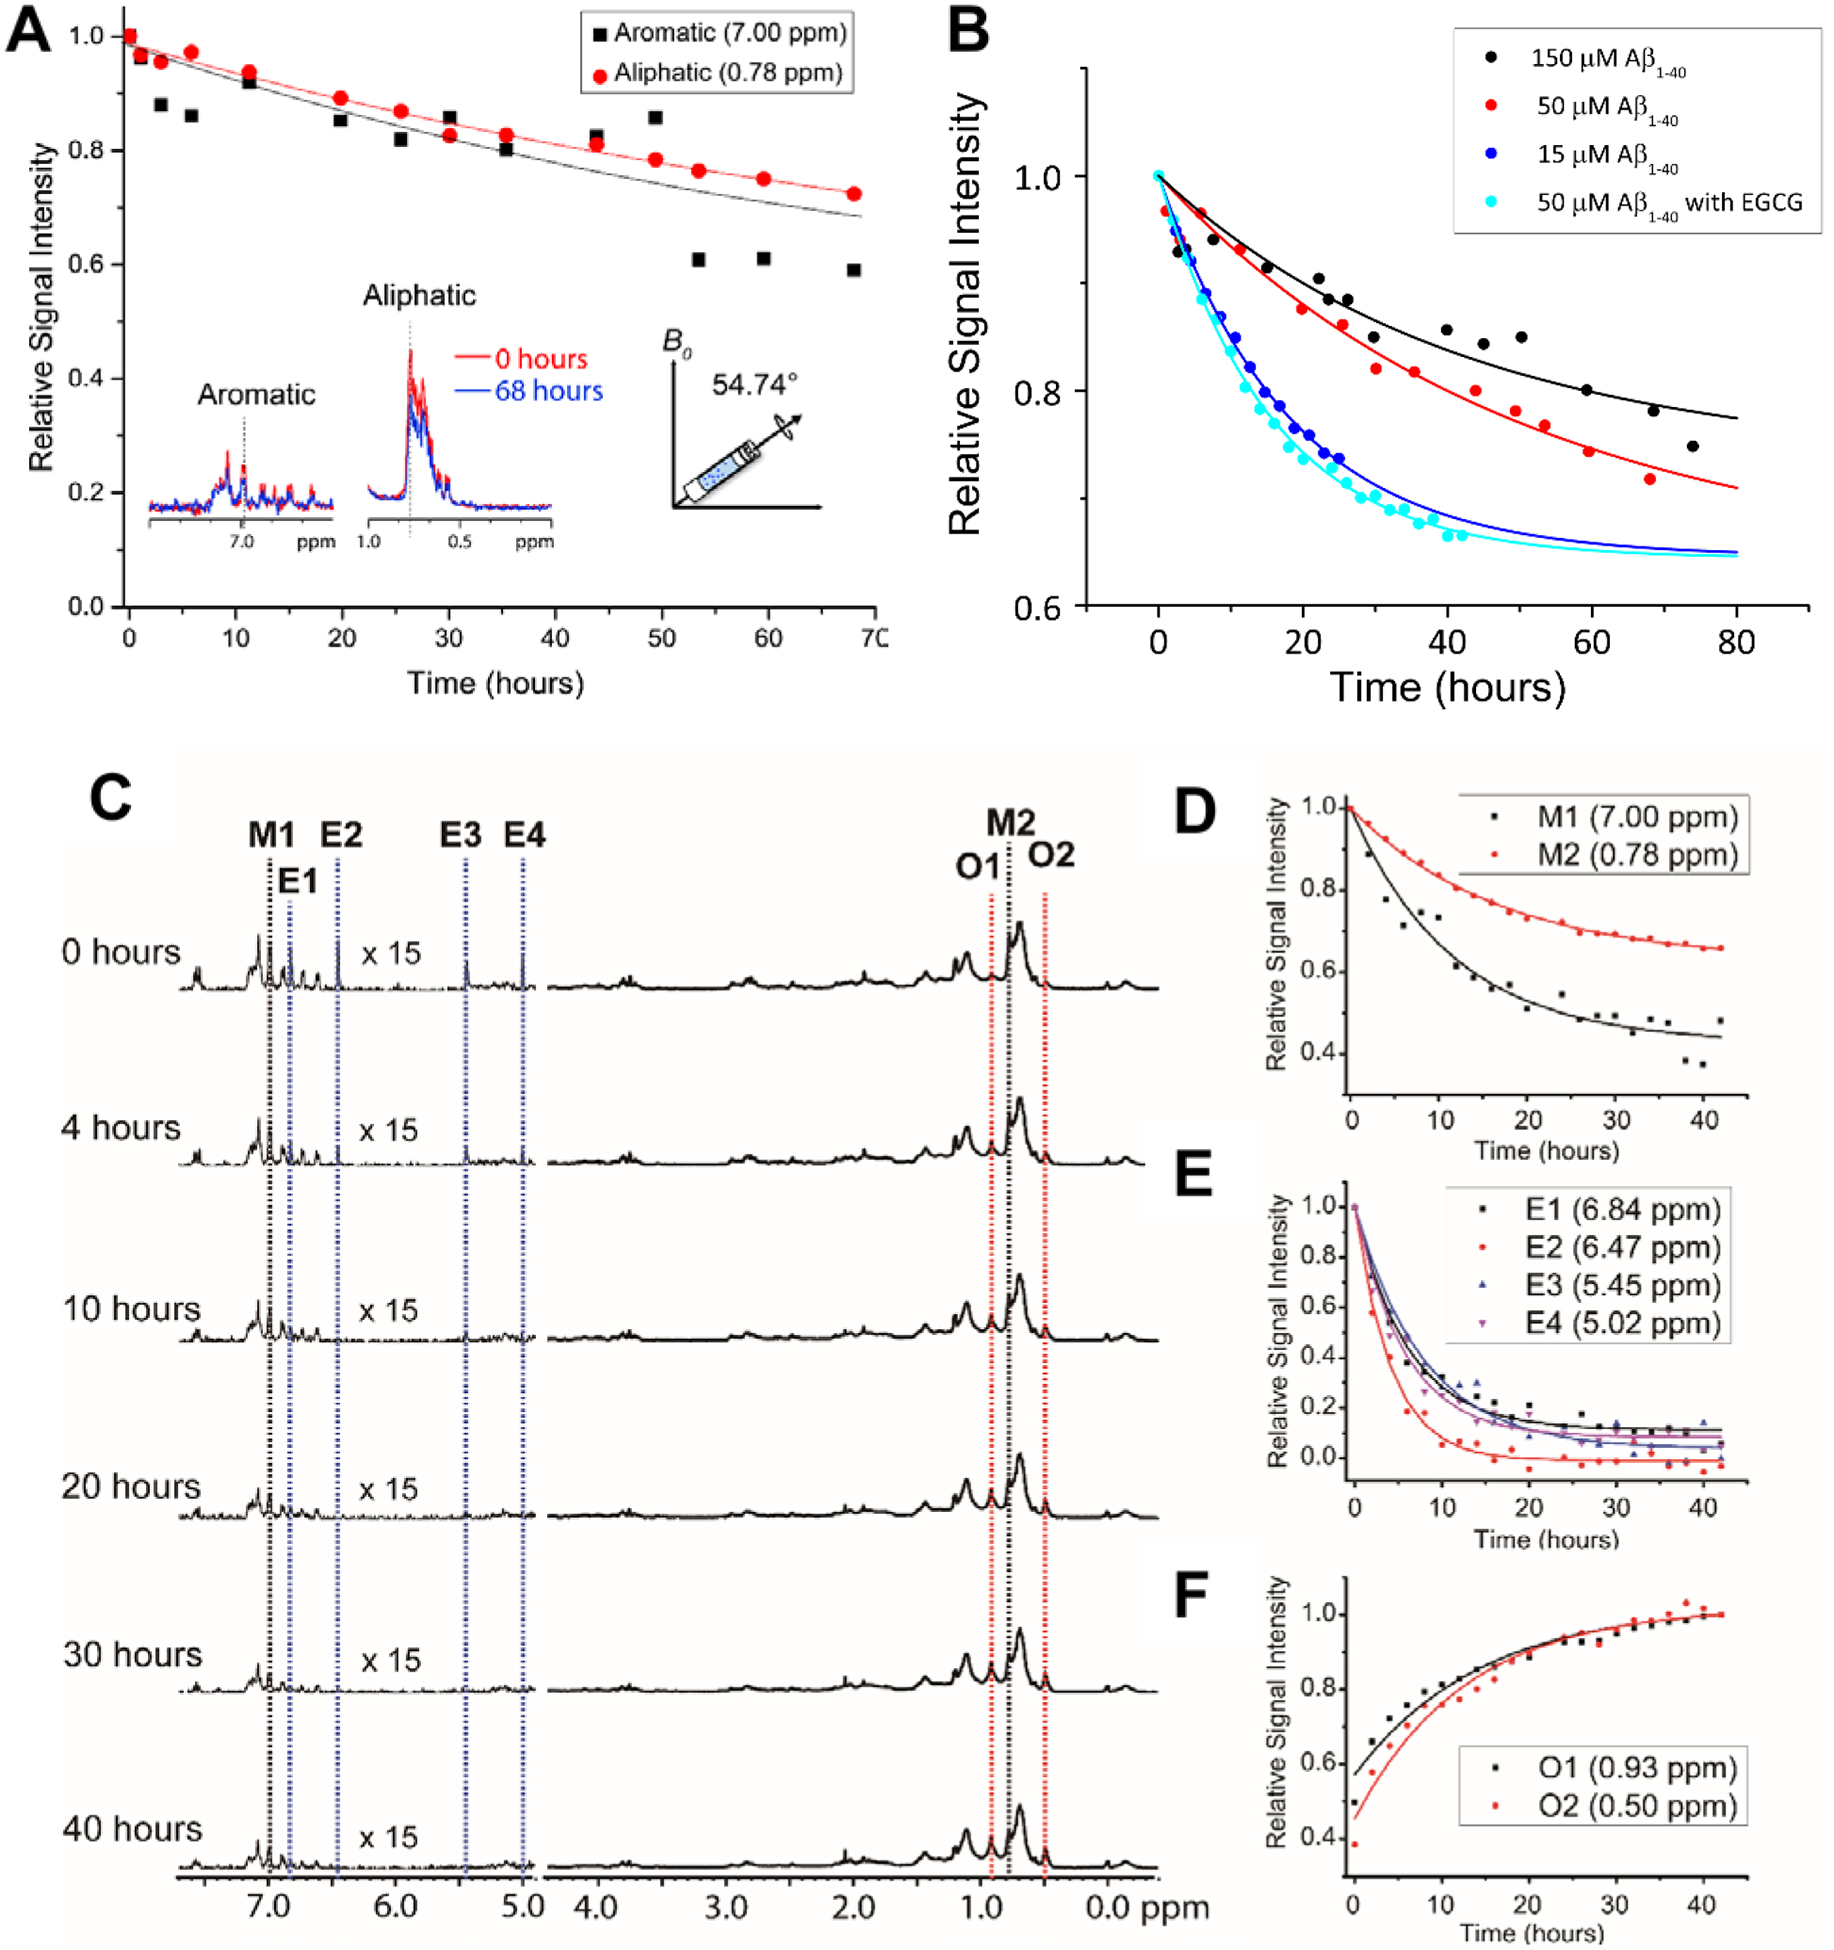
Fig. 2.

Effect of MAS on the aggregation kinetics of Aβ1–40. (A) Depletion in Aβ1–40 monomer population under MAS (5 kHz MAS at 298K) as indicated by the decay of 1H NMR signal intensity for selected aliphatic and aromatic resonances of freshly prepared 50 μM Aβ1–40 as a function of time (time=0 refers the data acquired in <10 minutes from the sample preparation). (B) Relative 1H NMR signal intensity decay of methyl resonance (0.78 ppm) under 5 kHz MAS as a function of Aβ1–40 monomer concentration in the absence or presence of EGCG. The curves were fitted using the equation y=(1-A)*exp(−b*x)+A, where A is the proportion that remains as monomer after saturation and b is the rate of decay or aggregation. (C) The polyphenolic EGCG compound promotes Aβ1–40 aggregation (50 μM) under MAS (under 5 kHz MAS and 298K) as observed from the decay of 1H NMR signal as a function of time. (D–F) The aromatic 1H signals decay faster as compared to aliphatic protons in Aβ1–40 (50 μM) in the presence of EGCG indicating the role of predominant π-π interactions. The aromatic proton signals of EGCG also show a rapid depletion in intensity (D) indicating a strong interaction with Aβ1–40. (E) The appearance of new peaks O1 and O2 indicates the formation of new oligomer species. An increase in the oligomer populations over time is revealed by an increasing 1H signal intensities O1 and O2 species. This figure is reproduced with permission from the Royal Society of Chemistry (https://doi.org/10.1039/C8CC00167G). Further details can be found in the referenced work.51
