
Fig. 4.
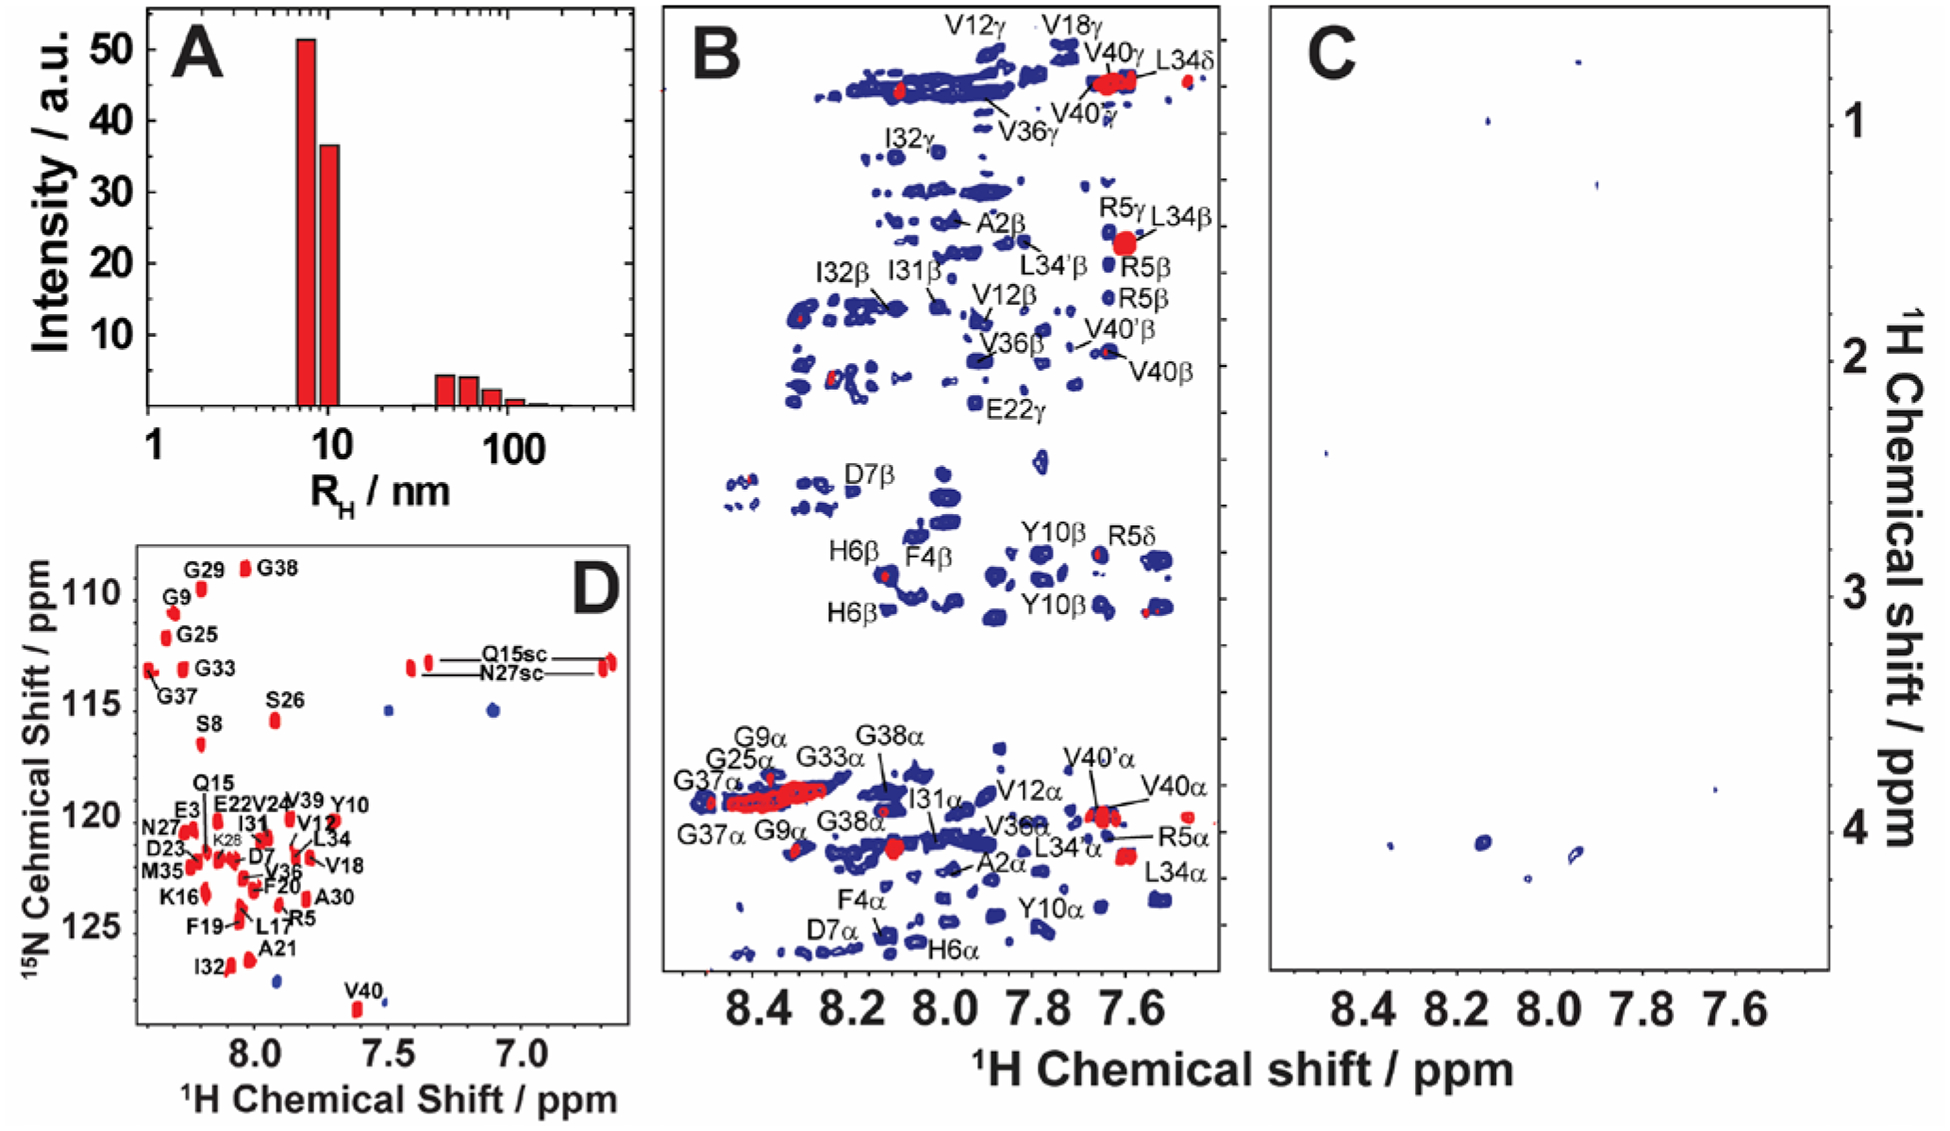
Monitoring time-lapse growth of Aβ1–40 oligomers by NMR. (A) Dynamic light scattering reveals the growth of Aβ1–40 oligomers from 8.6 nm and 65.3 nm over the course of 19 days. 2D TOCSY (B) and 2D NOESY (C) spectra of the disordered Aβ1–40 oligomers recorded at 4 days (blue) and 19 days (red). Both TOCSY and NOESY spectra show line-broadening on day-19 indicating the growth of oligomer size that are beyond the detection limit of solution NMR. (D) 2D 1H/15N HSQC spectra of the freshly dissolved (red) Aβ1–40 recorded on a 900 MHz NMR spectrometer show well resolved NMR peaks. In contrast, 1H/15N HSQC spectra of the filtered disordered oligomers (blue) obtained after 4 days show substantial line broadening. The NMR samples were prepared in 10 mM phosphate buffer, pH 7.4, and 10% D2O and NMR spectra were recorded at 25 °C. Copyright © 2015, Springer Nature. This figure is reproduced from Scientific Reports: https://doi.org/10.1038/srep11811. Further details can be found in the referenced study.103