


Fig. 6.
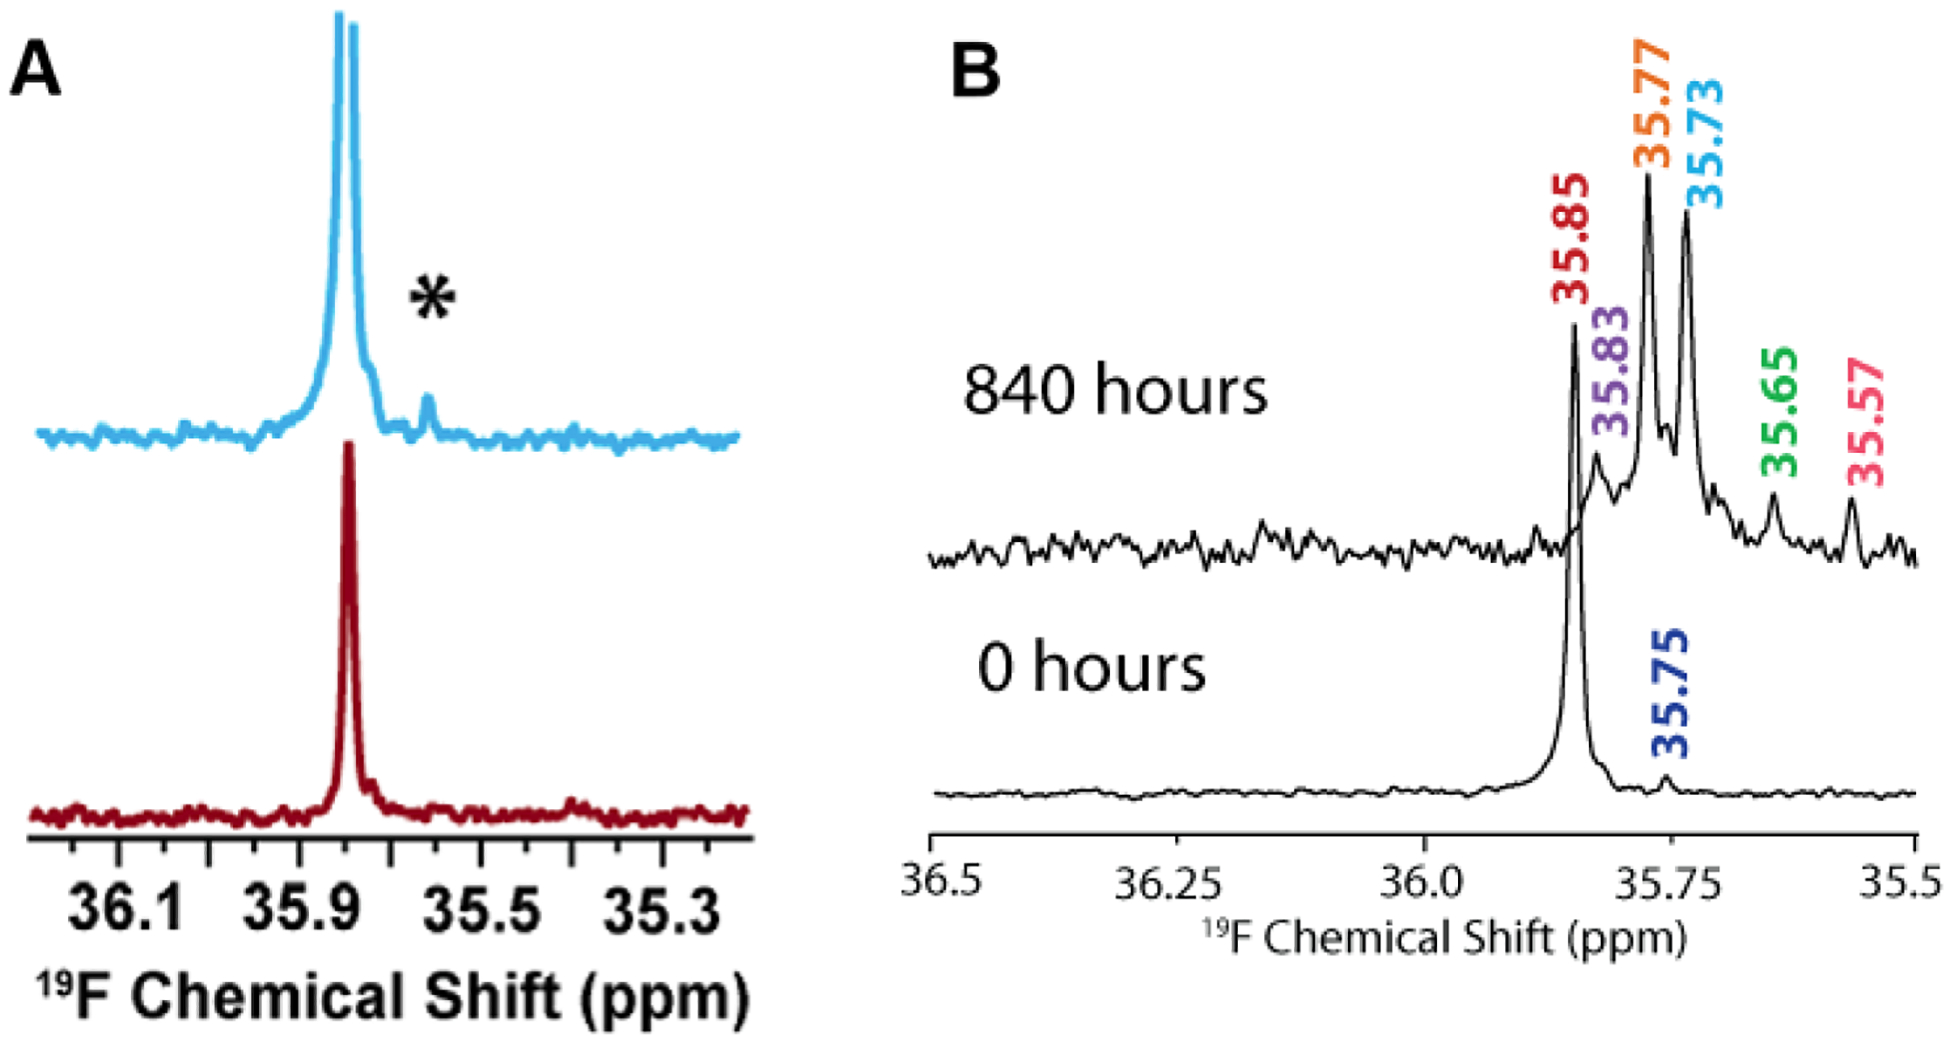
(A) Characterization of Aβ1–40 oligomers using 19F NMR. Fluorinated Aβ1–40-tfM35 showing the presence of an additional peak (denoted as *) for a freshly prepared 182 μM peptide sample (blue) as compared to 46 μM sample (red). The small additional peak indicates Aβ1–40-tfM35 oligomerization. The intensities of both samples are normalized to an internal TFE standard. (B) Monitoring the aggregation behavior of 182 μM Aβ1–40-tfM35 by 19F NMR at two different time intervals. The appearance of multiple peaks at 840 hours indicates the presence of variable sized Aβ1–40-tfM35 species. Copyright © 2013, American Chemical Society. This figure is reproduced with permission from dx.doi.org/10.1021/bi400027y: Biochemistry 2013, 52, 1903–1912. Further details can be found in the published study.115