
Fig. 8.
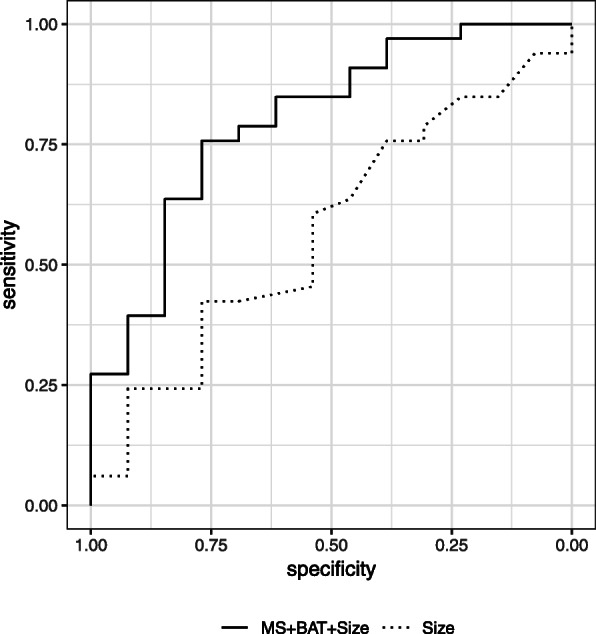
ROC curves of the logistic regression models for differentiating invasive carcinoma from DCIS. The AUC of the MS + BAT + size model was significantly higher than that of the size alone model: 0.80 vs. 0.56, P = 0.024
Official websites use .gov
A
.gov website belongs to an official
government organization in the United States.
Secure .gov websites use HTTPS
A lock (
) or https:// means you've safely
connected to the .gov website. Share sensitive
information only on official, secure websites.
ROC curves of the logistic regression models for differentiating invasive carcinoma from DCIS. The AUC of the MS + BAT + size model was significantly higher than that of the size alone model: 0.80 vs. 0.56, P = 0.024