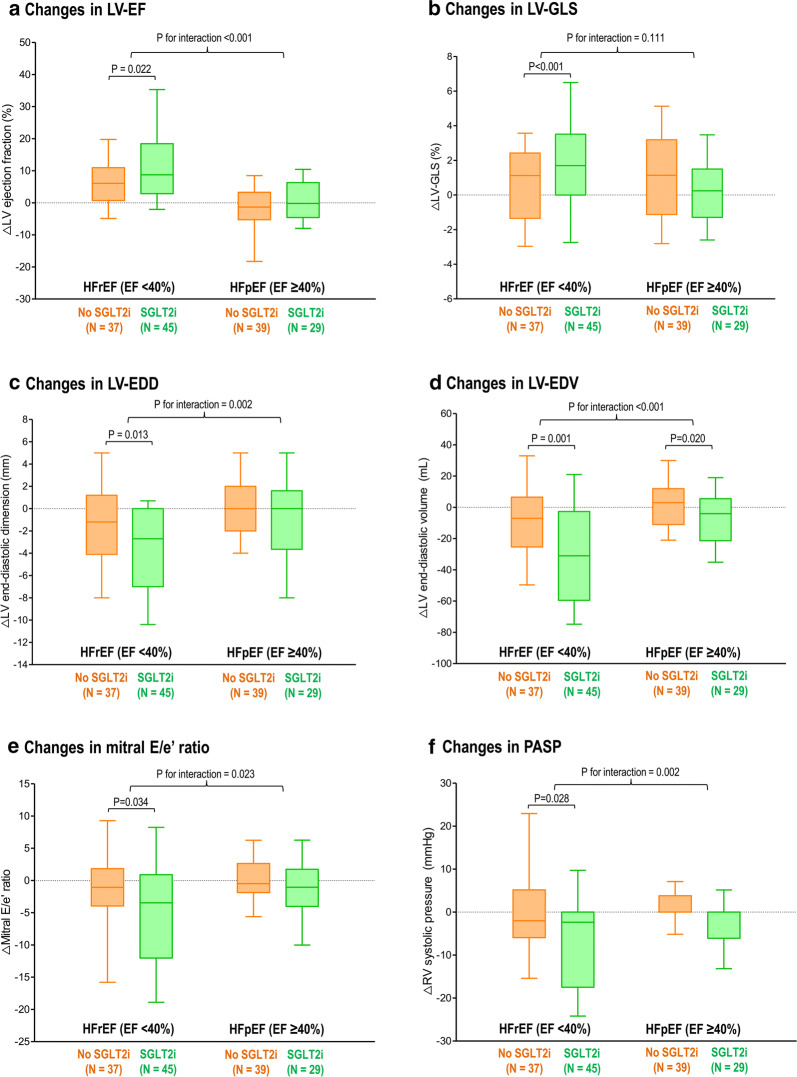
Fig. 3.
Changes in LV function and geometry by SGLT2i according to the types of HF. The changes in echocardiographic parameters were compared between subgroups divided according to the types of HF (HFrEF vs. HFpEF) and the use of SGLT2i: a LV-EF, b LV-GLS, c LV-EDD, d LV-EDV, e mitral E/e′ ratio, and f PASP. Bars represent the median with interquartile range (Q1–Q3). Intra-group and inter-group comparisons were performed with paired t-test generalized linear model for repeated measure analysis, respectively. Abbreviations as in Figs. 1 and 2

