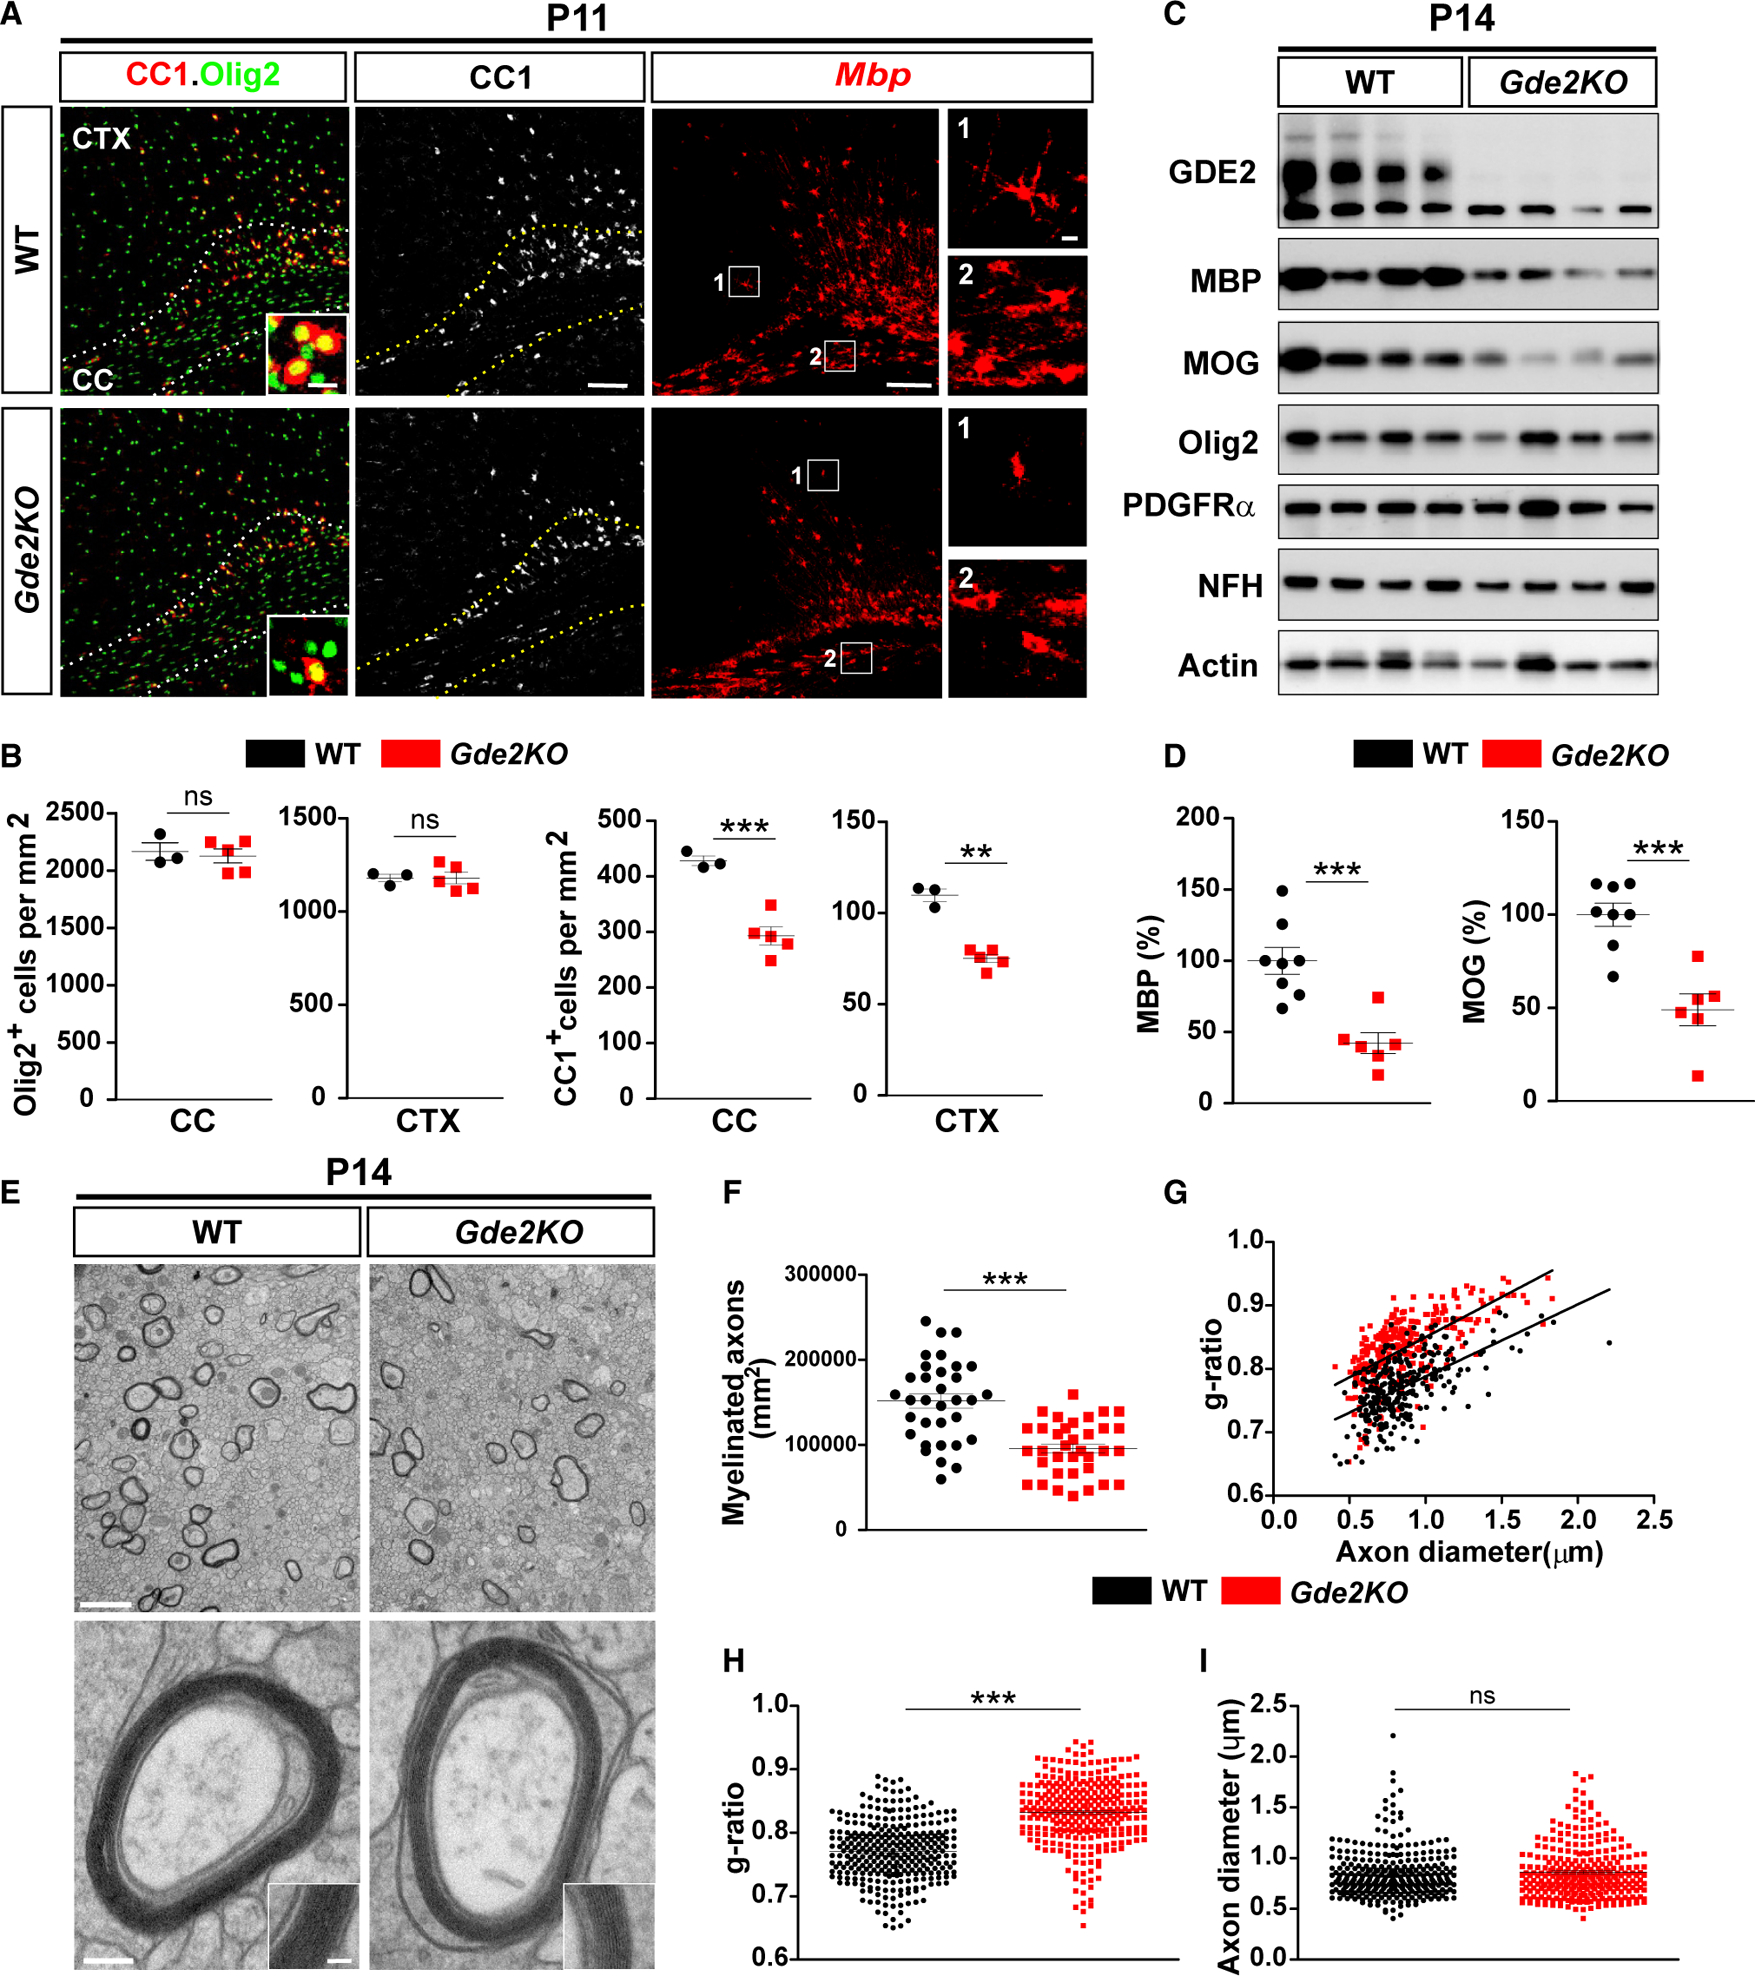
Figure 2. GDE2 Ablation Impairs OL Maturation.

(A) Coronal sections of motor CTX and CC. Hatched lines mark the CC. Insets and boxed areas show high magnification in the corresponding panels. (B) Graphs quantifying Olig2+ and CC1+ cells in CC and CTX. Nonsignificant (ns), p > 0.05; ***p = 0.0007; **p = 0.0035. n = 3 WT, n = 5 Gde2KO. (C) Western blot of cortical extracts. Actin was used as a loading control (Olig2, p = 0.1745; PDGFRα, p = 0.5163). (D) Graphs quantifying western blots for MBP (***p = 0.0005) and MOG (***p = 0.0009). n = 8 WT, n = 6 Gde2KO. (E) TEM of CC. (F–I) Graphs quantifying myelinated axons (F) (***p < 0.0001, points represent individual regions of interest [ROIs]), g-ratios (G and H) (***p < 0.0001, points represent individual myelinated axons), and axon diameter (I) (ns, p = 0.5523). n = 3 WT, 3 Gde2KO. All graphs show mean ± SEM, two-tailed unpaired Student’s t test. Scale bars represent 100 μm (A) (insets, 5 μm), 2 μm (E, top), and 100 nm (E, bottom) (inset, 50 nm).
