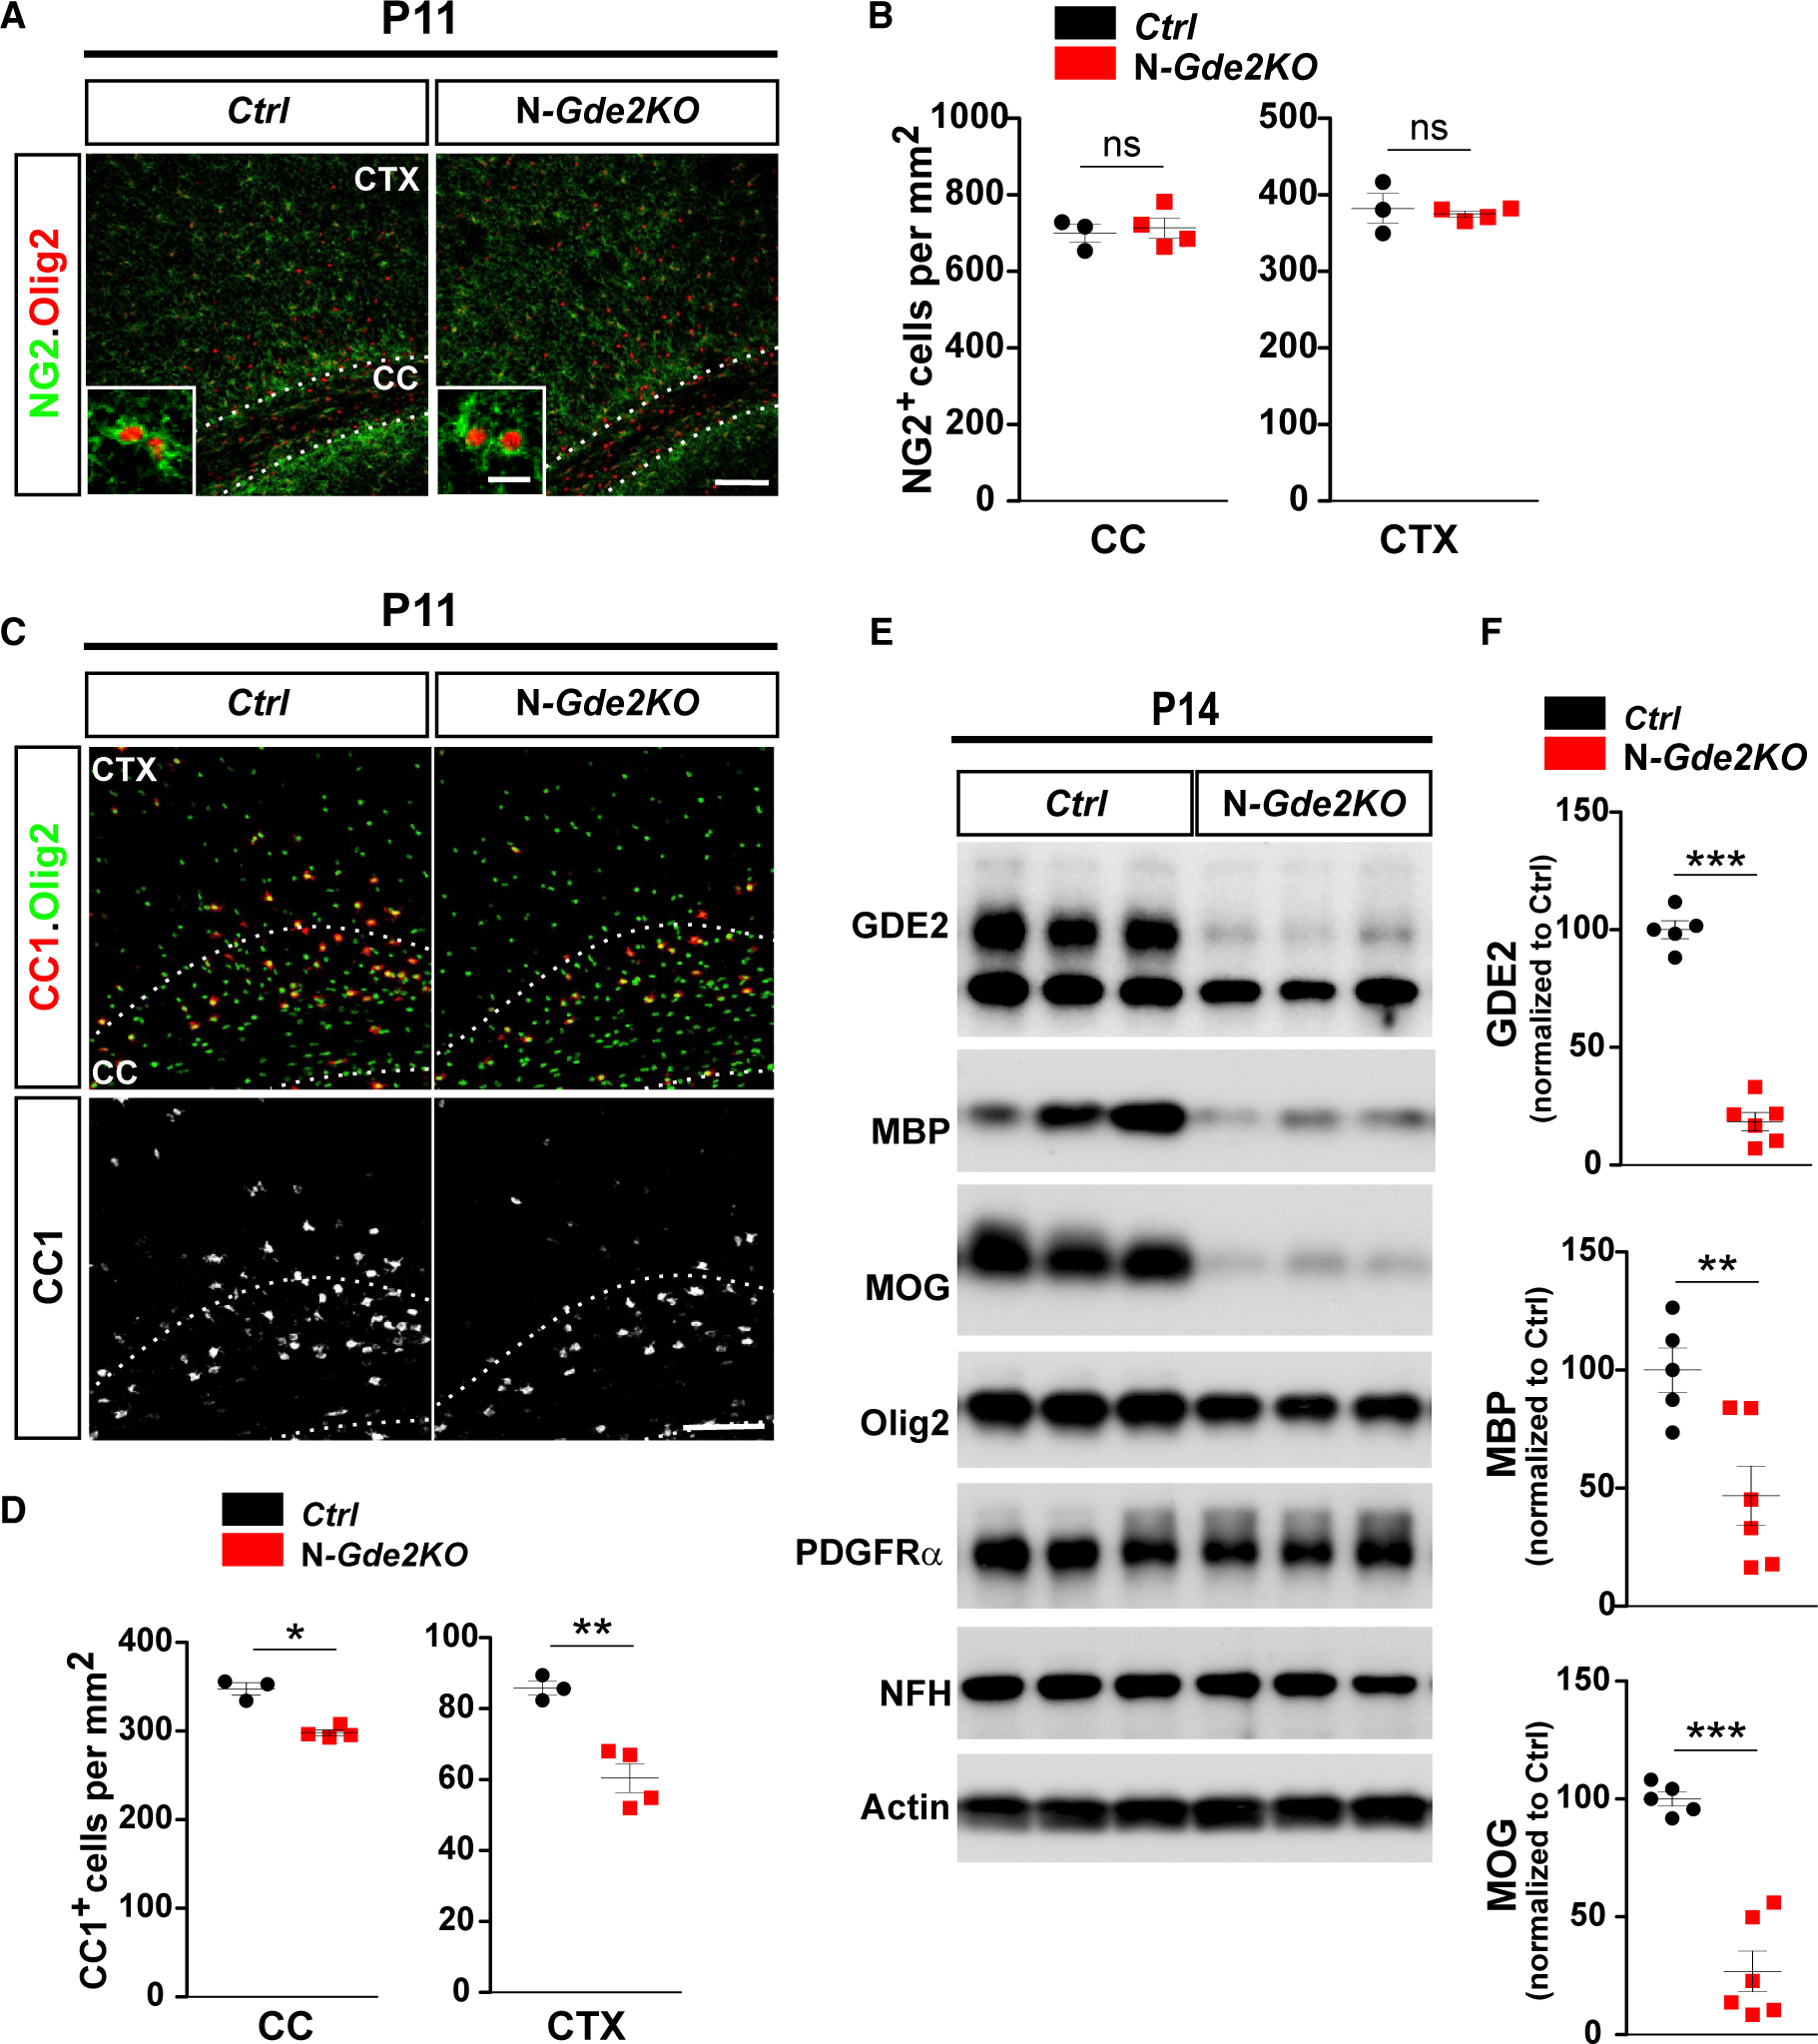
Figure 3. Neuronal GDE2 Promotes OL Maturation.

(A and C) Coronal sections of motor CTX and CC showing NG2 (A) and CC1 (C) expression with Olig2 . Hatched lines mark the CC. Ctrl: Gde2+/−;Nex-Cre N-Gde2KO: Gde2lox/−;Nex-Cre. (B and D) Graphs quantifying NG2+ OPCs and CC1+ cells in CC and CTX. (B) ns p > 0.05, (D) *p = 0.0227, **p = 0.0052. n = 3 Ctrl, 4 N-Gde2KO. (E) Western blot of cortical extracts. Actin was used as a loading control. Levels of Olig2 (p = 0.5804) and PDGFRα (p = 0.4708) are unchanged between genotypes. (F) Graphs quantifying western blots (GDE2, ***p < 0.0001; MBP, **p = 0.0091; MOG, ***p = 0.0002). n = 5 Ctrl, n = 6 N-Gde2KO. All graphs show mean ± SEM, two-tailed unpaired Student’s t test. Scale bars represent 100 μm (A and C), 10 μm (inset A).
