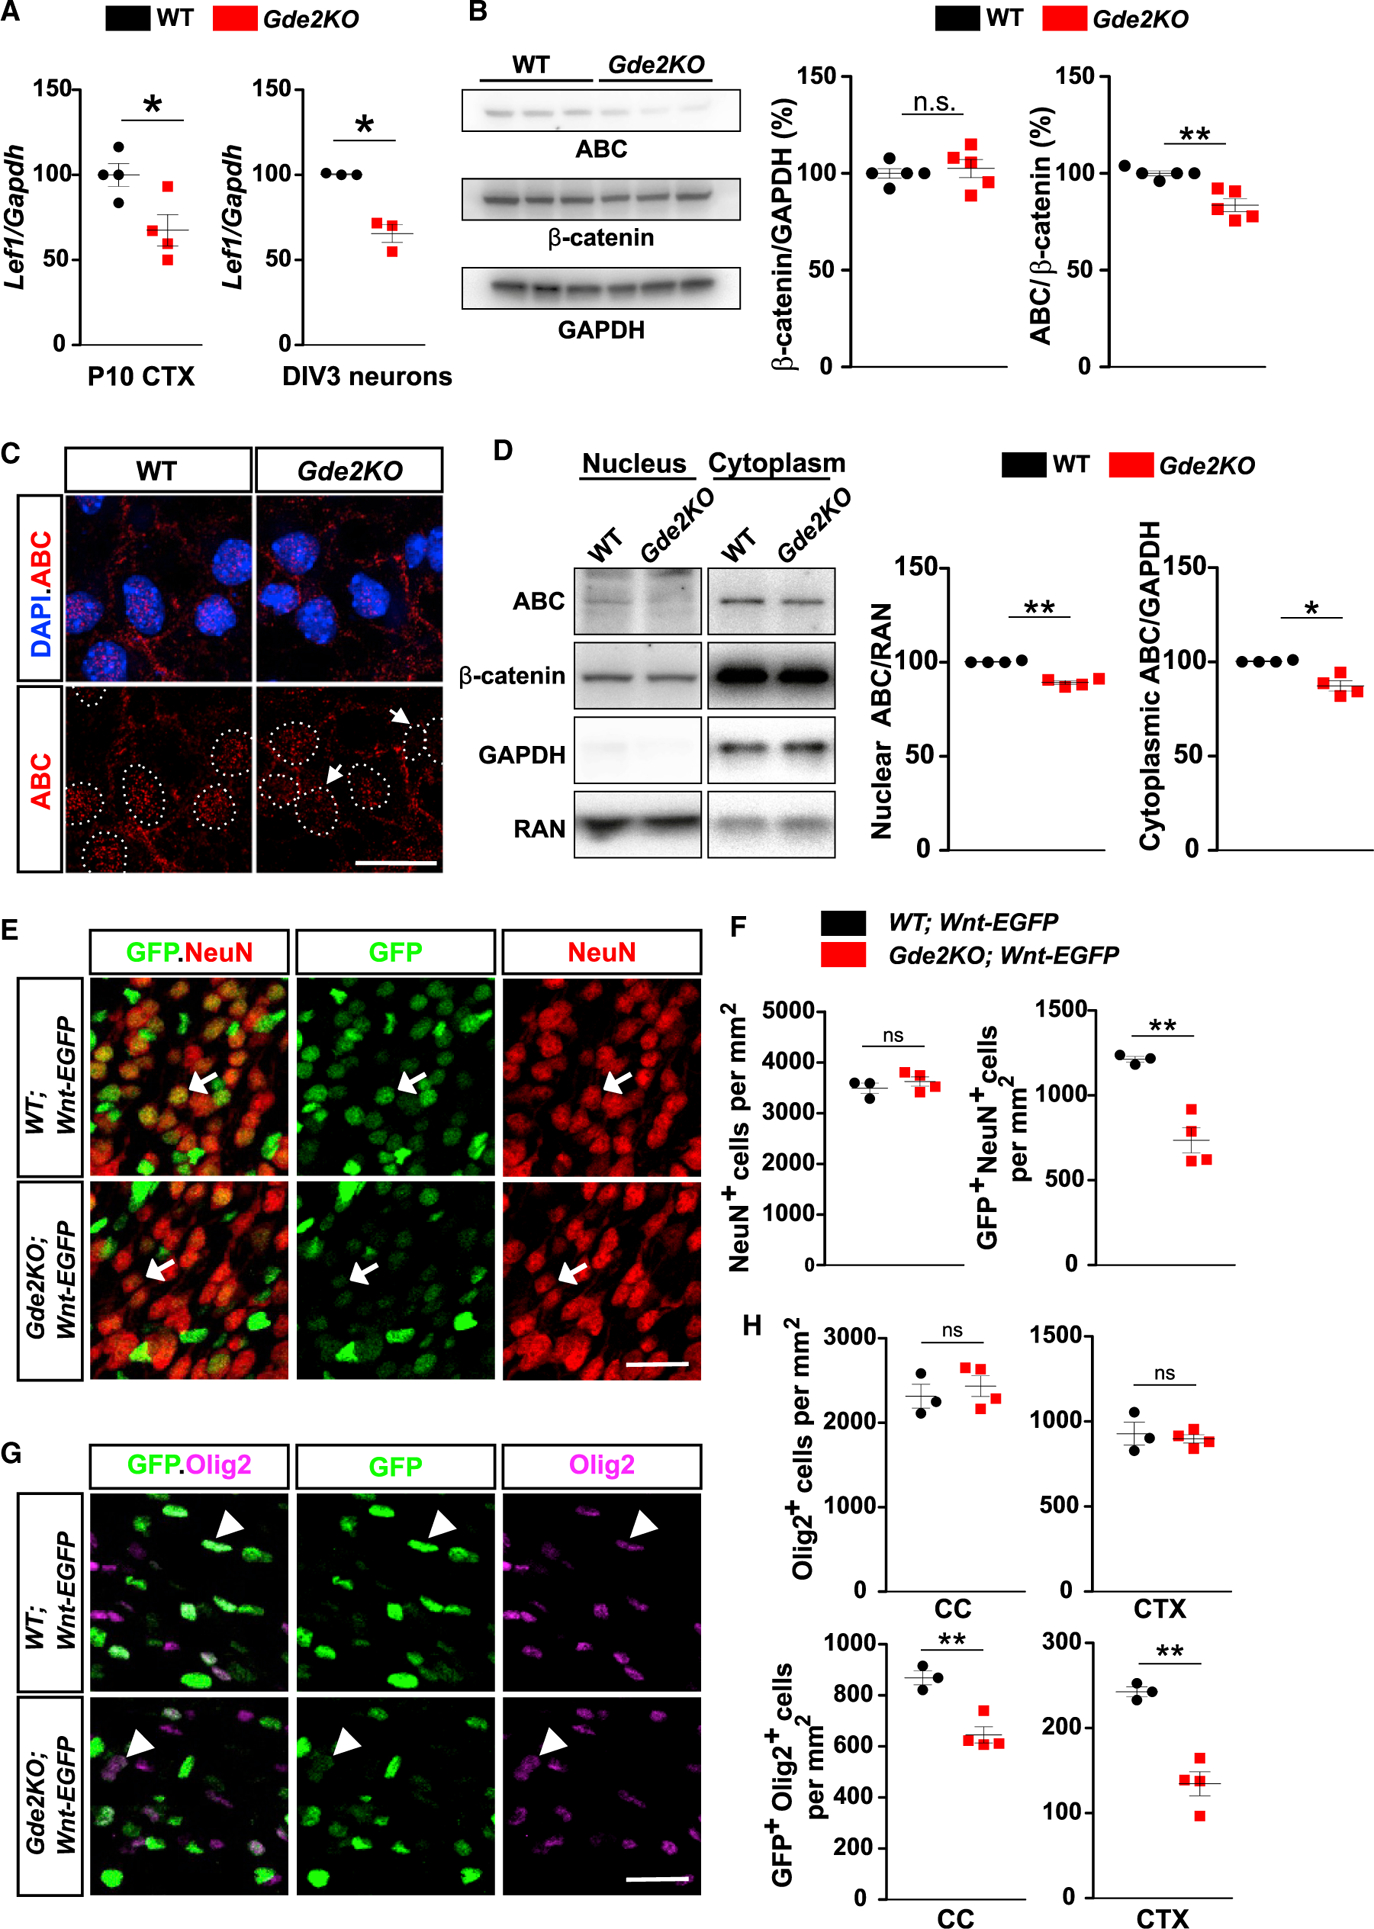
Figure 5. Canonical Wnt Signaling Is Reduced in Gde2KO Neurons and Oligodendroglia.

(A) Graphs quantifying qPCR of Lef1 transcripts normalized to Gapdh mRNAs. CTX, *p = 0.0231, n = 4 WT, n = 4 Gde2KO; DIV3 cortical neurons, *p = 0.0362, n = 3 WT, n = 3 Gde2KO. (B) Western blot of DIV3 cortical neurons with associated quantification. ns, p = 0.6465; **p = 0.0018; n = 5 WT, n = 5 Gde2KO. (C) Images of cultured cortical neurons. Arrows mark reduced ABC nuclear (hatched lines) staining. (D) Western blot of fractionated DIV3 cortical neuron extracts. Graphs quantifying ABC normalized to RAN and GAPDH, **p = 0.0019, *p = 0.0186, n = 4 WT, n = 4 Gde2KO. (E and G) Coronal sections of P11 CTX. (E) Arrows show differential GFP expression in neurons in WT and Gde2KO;Wnt-EGFP mice. (G) Arrowheads mark differential GFP expression in Olig2+ cells in WT and Gde2KO;Wnt-EGFP mice. (F) Graphs quantifying neurons and GFP+ neurons in WT and Gde2KO;Wnt-EGFP mice. ns, p = 0.3936; **p = 0.0078. H) Graphs quantifying Olig2+ and GFP+ Olig2+ cells in WT and Gde2KO;Wnt-EGFP mice. ns, p > 0.05, CC **p = 0.006, CTX **p = 0.0057. For (F) and (H), n = 3 WT;Wnt-EGFP, 4 Gde2KO;Wnt-EGFP. All graphs show mean ± SEM, two-tailed unpaired Student’s t test. Scale bars represent 5 μm (C) and 20 μm (E and G).
