Fig. 3.
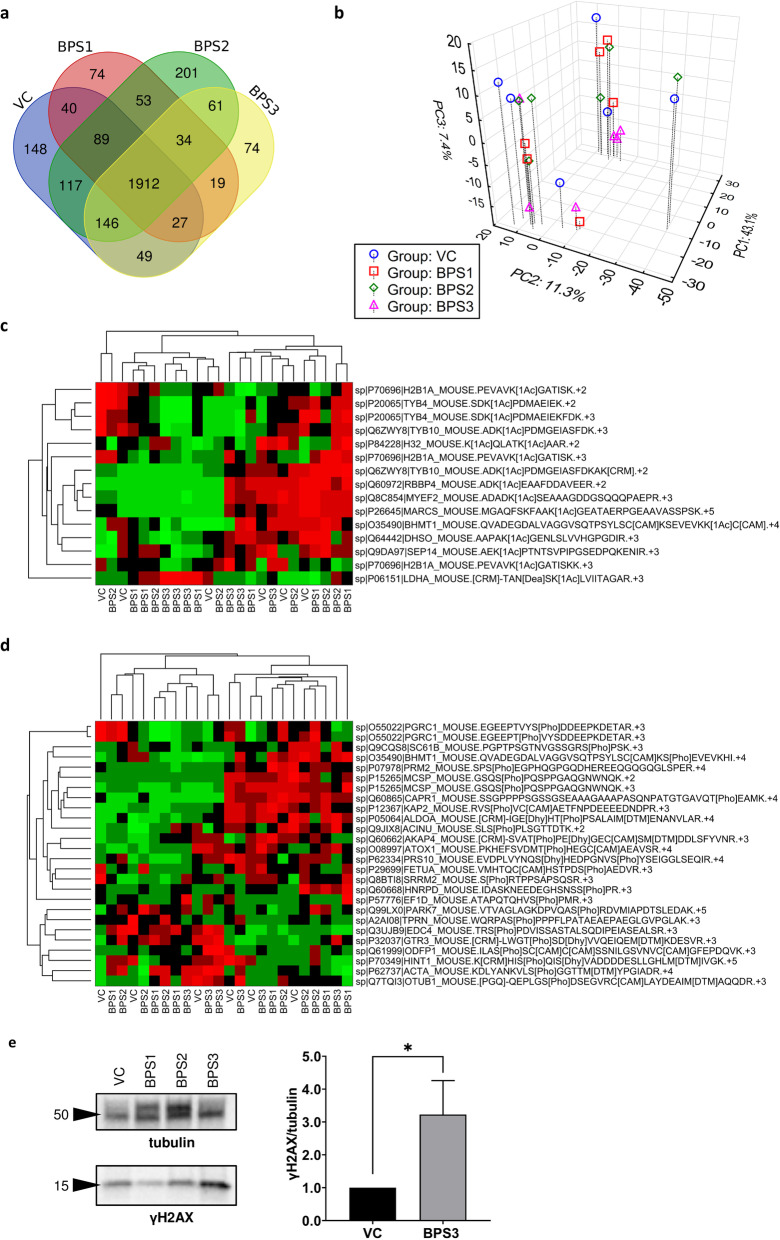
Proteomic analysis of testicular tissues. (a) Venn diagram of total described testicular proteins in mice (n = 4) after various treatments in different experimental groups. (b) Projection of 24 experimental mice into the space of first three principal components according to PCA; percentages in the axis legends show the proportion of total variance explained by the particular component. (c) Overview of acetylated and (d) phosphorylated testicular proteins. (e) Analysis of γH2AX; band signals were normalized to α-tubulin and related to the vehicle control as the mean (range) of three independent experiments. Unpaired t tests were performed, and statistical significance is indicated (*p < 0.05). VC: vehicle control, BPS1–3: increasing doses of bisphenol S

