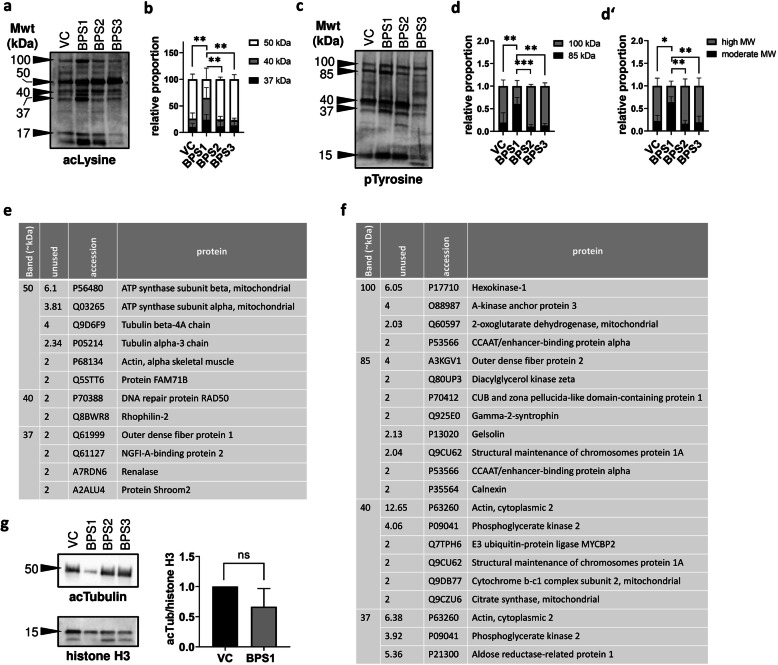
Fig. 4.
Sperm acetylome and phosphorylome analyses. (a) Acetylated sperm proteins (acetylated lysine) with major bands. (b) Densitometric analysis of the ratio of candidate bands. (c) Phosphorylated sperm proteins (phosphorylated tyrosine) with major bands. (d) Densitometric analysis of the ratio of 100- to 85-kDa bands. (d’) The ratio of 37–40-kDa (moderate) to 85–100-kDa (high) molecular weight bands. Differential counting was expressed as means (ranges) of three independent experiments. Differences were tested by two-way ANOVA, followed by Tukey’s multiple comparison test, and asterisks indicate statistical significance *p < 0.05, **p < 0.01, ***p < 0.001, and ****p < 0.0001. (e) Candidate acetylated and (f) phosphorylated proteins from individual bands were evaluated using MALDI-TOF MS-based peptide detection. Analysed sperm samples represent a pool of three animals per experimental group from three independent replicates. (g) Densitometric analysis of acetylated tubulin from BPS1-treated sperm. VC: vehicle control, BPS1–3: increasing doses of bisphenol S

