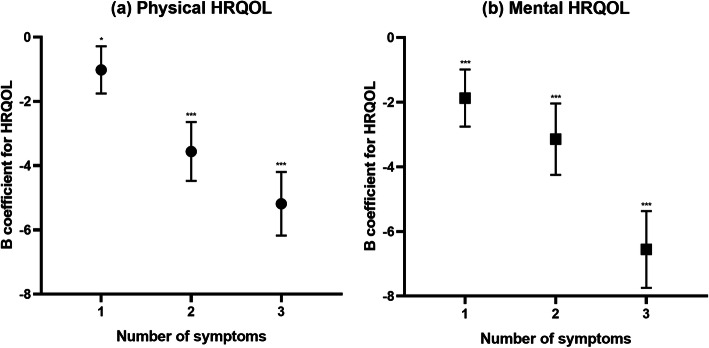
Fig. 3.
Association between number of symptoms and HRQOL. HRQOL: health-related quality of life. *P < 0.05, ***P < 0.001. Linear regression model for physical and mental HRQOL with number of symptoms as a dummy variable (no symptoms as the reference group) after adjusting for sex, age, region, occupation, income, education, marital status, smoking, alcohol consumption, physical activity, and disease history. (a) Linear regression of PCS; B = − 1.01, − 3.55, − 5.18 for one, two, and three or more symptoms, respectively. (b) Linear regression of MCS; B = − 1.87, − 3.14, − 6.55 for one, two, and three or more symptoms, respectively

