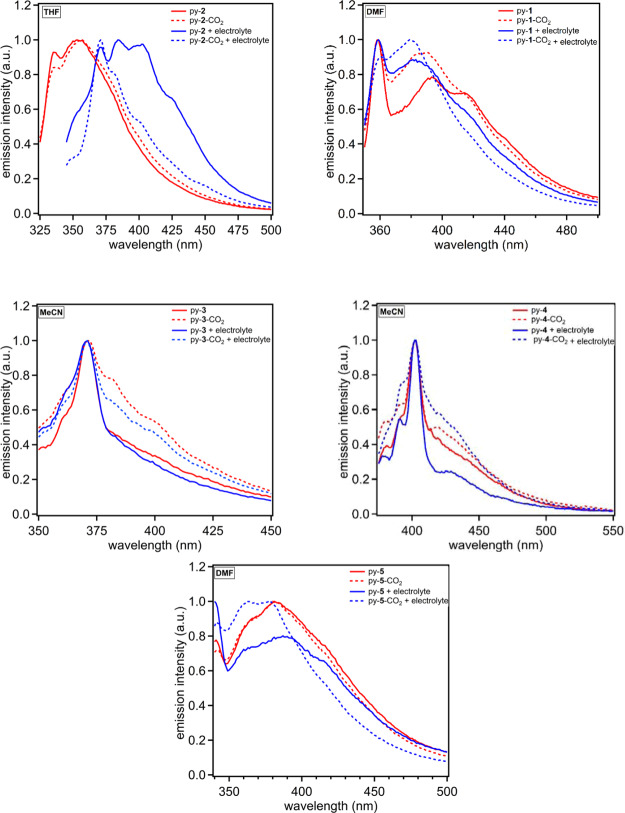
Figure 5.
Emission spectra of py-1 in DMF (top left), py-2 in THF (top right), py-3 in MeCN (middle left), py-4 in MeCN (middle right), and py-5 in DMF (bottom). The solid lines denote under an inert atmosphere, and dashed lines represent the presence of CO2. Red curves are in the absence of TBAPF6, and blue curves are in the presence of 0.1 M TBAPF6.

