Figure 3.
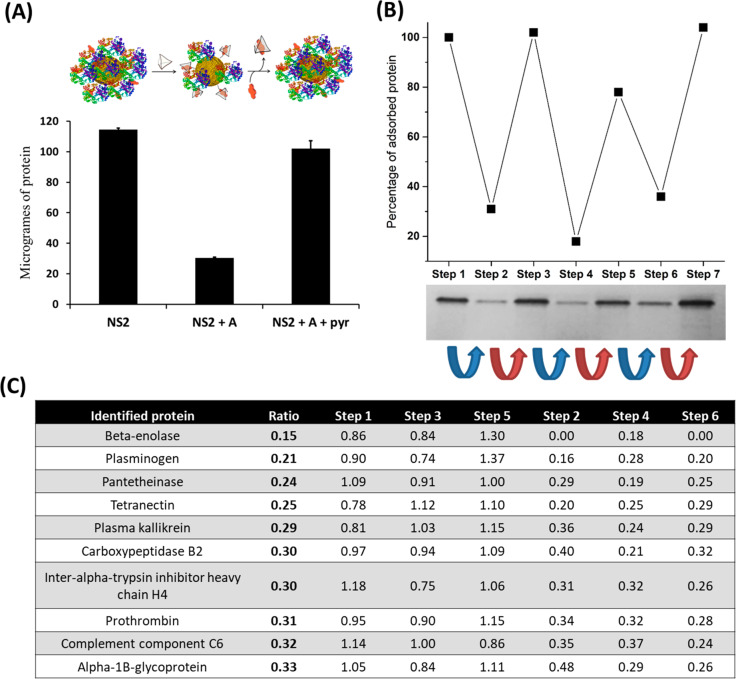
Comparison of the amount and type of FBS proteins immobilized on NS2 particles upon addition of cage A and pyr. (A) (top) Schematic representation of the NP-protein system for each gel line. (bottom) NS2: BCA analysis for only NS2 (200 μL, 7.5 × 10¹¹ particles/mL) diluted in FBS (5% in PBS). NS2 + A: same conditions as NS2 lane, followed by addition of 20 μM of cage A and 10 min of incubation. NS2 + A + pyr: same conditions as NS2 + A, followed by addition of 50 μM of free pyr and 10 min of incubation. (B) Cyclic addition to a colloidal dispersion of NS2 (1.5 mL, 7.5 × 10¹¹ particles/mL) in diluted FBS (5% in PBS), with 10 μM of cage A (blue arrow) and 30 μM of free pyr (red arrow). After each addition, the dispersion was incubated for 10 min. Subsequently, the amount of adsorbed protein on 1.5 × 10¹¹ particles was evaluated by stacking SDS-PAGE (bottom) and quantified using ImageJ (top). (C) List of proteins comprising the PC on NS2, for which the relative abundance increases or decreases more than threefold during the cage/pyranine cycle of the former SDS-PAGE assay, based on LC-MS/MS analysis. The ratio parameter is defined as the average relative abundance of the protein in steps 2, 4, and 6, (low protein immobilization) divided by the relative abundance in steps 1, 3, and 5 (high protein immobilization). Steps 1–6 are normalized to the abundance of the protein in each step.

