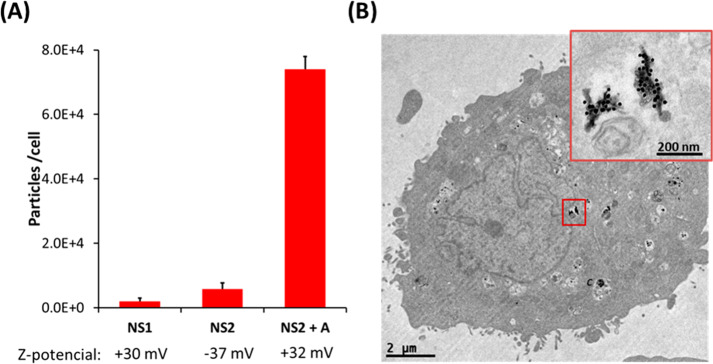
Figure 4.
Uptake experiments in HeLa cells. (A) All NPs were incubated with cells using DMEM medium supplemented with 10% FBS, for 24 h, at 9 × 10¹⁰ NP/mL. For NS2 + cage A, 5 μM cage A was used. Zp values for each NP are indicated below the graph. The degree of internalization was quantified by ICP-MS. (B) TEM images of a HeLa cell incubated under the conditions described for NS2 + A.

