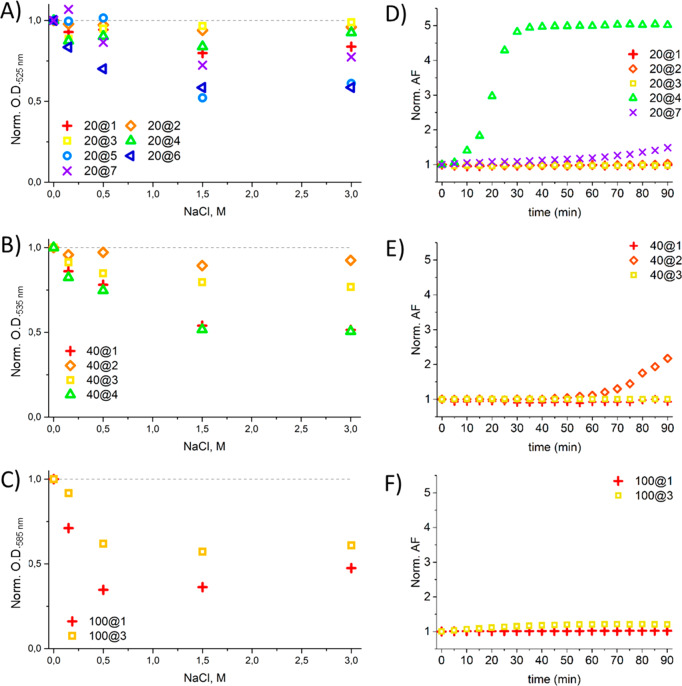
Figure 6.
GNP stability to electrolytes and DTT. Aggregation tendencies in 0–3 M NaCl are shown for: (A) 20 nm, (B) 40 nm, and (C) 100 nm GNPs. The Y-axis represents O.D. at the LSPR peak maximum, the wavelength of which varies with GNP size and is as follows: (A) 525 nm, (B) 535 nm, and (C) 585 nm. The O.D. is normalized to the value for 0 mM NaCl in each case. A decrease in normalized O.D. indicates aggregation. Aggregation after exposure to 1 M DTT is expressed by the normalized aggregation factor (AF) for: (D) 20 nm, (E) 40 nm, and (F) 100 nm GNPs. Exposure to DTT was conducted in the presence of NaCl at the following concentrations: (D, E) 400 mM and (F) 150 mM.

