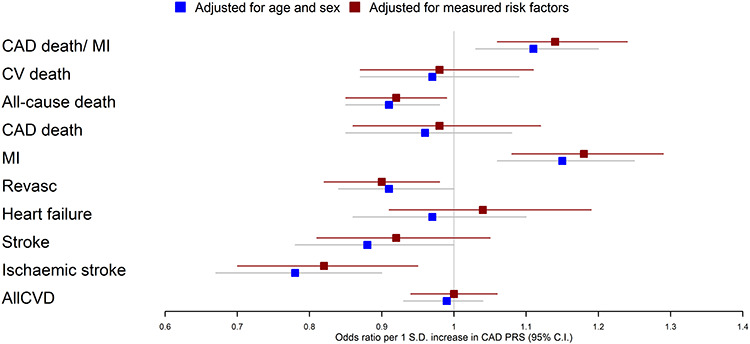
Figure 3.

Associations between a CAD PRS and 10 incident fatal/CV outcomes. One analysis (blue) only included age and sex as covariates, while the other analysis (red) included additional CAD risk factors as covariates (BMI, SBP, statins, type II diabetes and ever smoking status).
