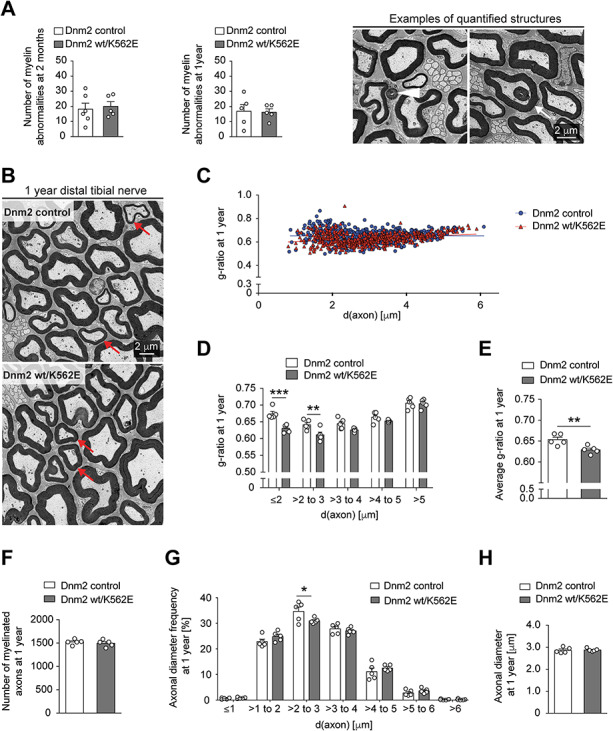
Figure 2.

The Dnm2 wt/K562E mouse displays no overt histological signs of a neuropathy. (A) Evaluation of myelin abnormalities including outfoldings (white arrowhead) and infoldings (white arrow) throughout entire cross sections of distal tibial nerves in EM panoramas reveals no significant differences between control and Dnm2 wt/K562E nerves at 2 months and 1 year of age. Bar heights, mean; error bars, SEM (n = 5 mice for Dnm2 wt/K562E at both time points and for controls at 1 year, n = 6 mice for controls at 2 months). Example images, derived from 2-month-old Dnm2 wt/K562E mutants, are used to show quantified features. (B) Exemplary EM picture of distal tibial nerve cross sections of control and Dnm2 wt/K562E animals at 1 year of age, highlighting axons of similar, relatively small, diameter between both genotypes (red arrows) which display thicker myelin in the Dnm2 wt/K562E sample. Scale bar: 2 μm, refers to the whole panel. (C) Scatter plot of g-ratio versus axonal diameter derived from the analysis of EM micrographs from 1-year-old distal tibial nerve. Three random areas were quantified within the cross-section panorama, and all myelinated axons (excluding those showing myelin abnormalities) located within these areas were measured. Every datapoint represents one axon (n = 5 mice/genotype; at least 100 axons from each animal were quantified). (D, E) Binned g-ratio distribution per axonal diameter (D) and average g-ratio (E) of 1-year-old distal tibial nerves (same nerves analysed as depicted in C). Dnm2 wt/K562E mice show a slightly lower g-ratio, especially on smaller-calibre axons, indicative of thicker myelin compared to control animals. Bar heights, mean; error bars, SEM (n = 5 mice/genotype). (F–H) Number of myelinated axons (F), frequency distribution of axonal diameter bins (G) and average axonal diameter (H). All myelinated axons (F) and myelinated axons without myelin abnormalities (G, H) were measured on the entire cross section of distal tibial nerve EM panoramas at 1 year of age. No detectable systematic shrinking of Dnm2 wt/K562E axons relative to controls was found. Bar heights, mean; error bars, SEM (n = 5 mice/genotype). Two-way ANOVA with Sidak’s multiple comparisons test (D, G) and two-tailed unpaired Student’s t-test (A, E, F, H). Significance was set at *P < 0.05, **P < 0.01 and ***P < 0.001.
