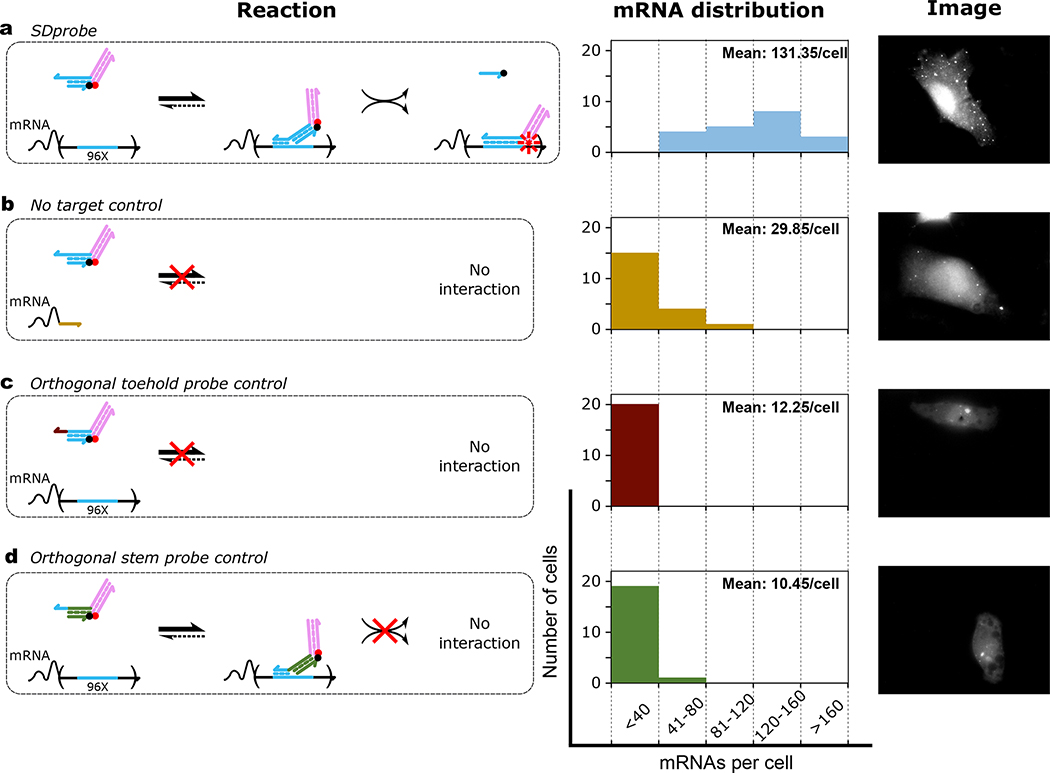
Figure 2. Intracellular mRNA detection using strand displacement probes with extension domains (SDProbe_v1).
Each row demonstrates the reaction mechanism for interaction of probes with mRNAs (left), histogram of detected mRNAs per cell (middle) and representative image (right). For quantifying the distribution of detected mRNAs per cell, 20 randomly selected cells were imaged for each of the four different conditions: probes were electroporated to a) HT1080–96X cells expressing GFP mRNAs with 96 tandem repeats of probe target sites in the 3’-UTR, b) HT1080-control cells expressing GFP mRNAs without probe target sites. HT1080–96x cells were electroporated with SD control probes similar to SDProbe (SDProbe_v1) but with c) a toehold orthogonal to the corresponding section of the probe target sequence, and d) a double stranded stem domain orthogonal to the probe target sequence. For each case, the mean number of spots detected per cell is shown as inset to the histograms.

