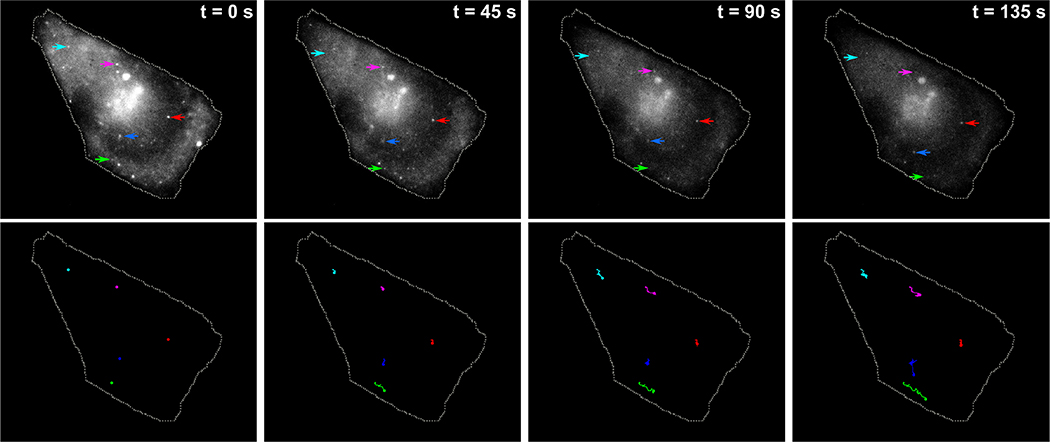
Figure 3. Visualizing intracellular mRNA movement using strand displacement probes.
Five separate target mRNAs were tracked over a period of 150 seconds using time-lapse imaging. Top row consists of a montage of four frames showing positions of five specific mRNAs (indicated by five distinctly colored arrows) at different timepoints. The trajectories of the corresponding mRNAs up to that time-point are shown in the bottom row.

