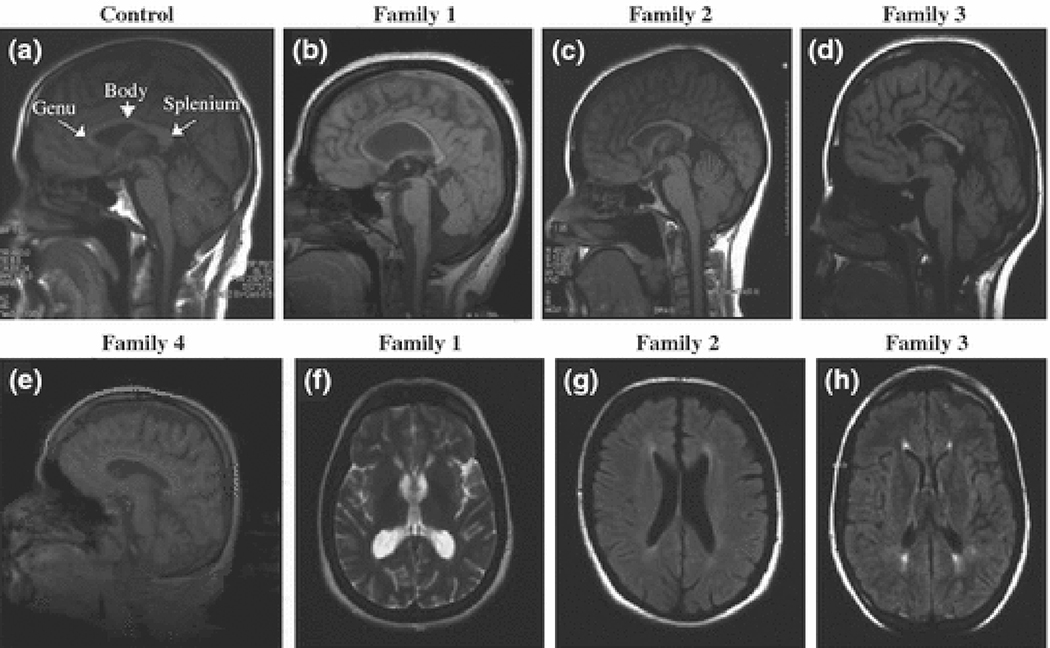
Figure 2.
T1 (b–e, g, h) and T2 weighted (2f) MRI brain scans of the probands from families 1, 2, 3 and 4. (a) shows a control MRI scan with the different parts of a normal labelled corpus callosum. Sagittal sections (c and d) show considerable thinning of the corpus callosum. (d) and (e) show mild thinning of the body as well as cortical and cerebellar atrophy. There are white matter abnormalities around the ventricles in images from families 2 (g) and 3 (h), but not family 1(f) and 4.

