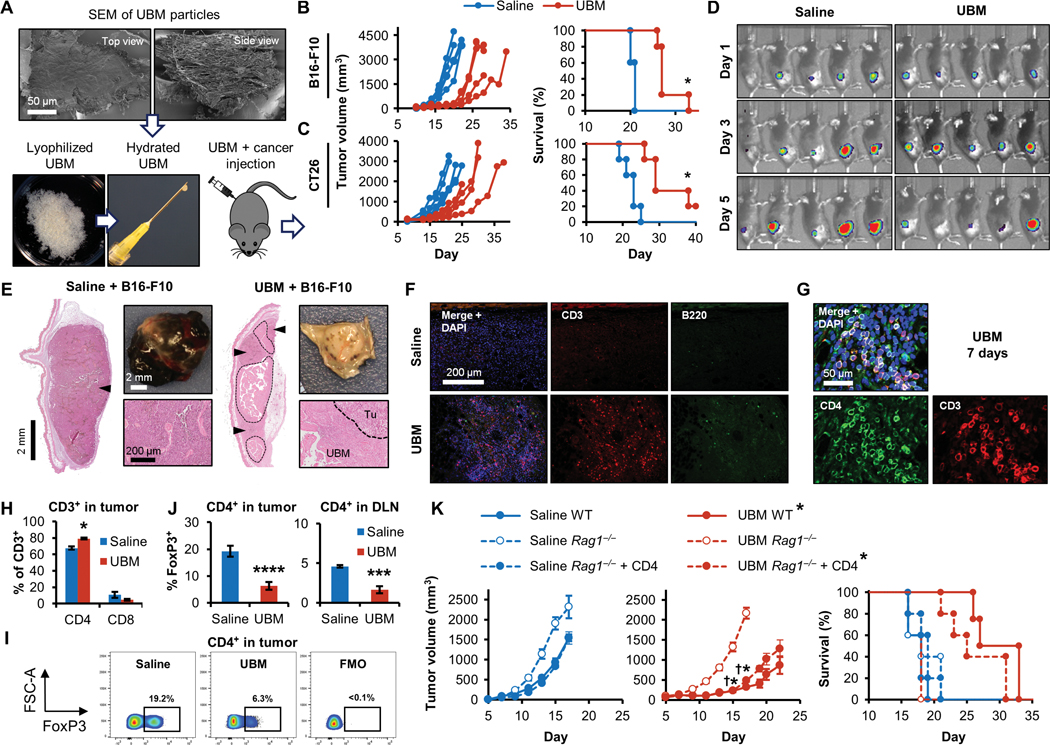
Fig. 1. Tissue-derived UBM particles inhibit tumor formation in a CD4+ T cell-dependent manner.
(A) Scanning electron microscopy (SEM; top view and side view) of decellularized bladder (UBM) particles. UBM particles were hydrated and injected with cancer cell lines into mice to monitor the effect the UBM microenvironment on tumor formation. Tumor volume and survival in (B) B16-F10 melanoma (C57BL/6 mice; n = 5) and (C) CT26 colon carcinoma (BALB/c mice; n = 5). (D) Bioluminescence imaging of luciferase-expressing B16-F10 melanoma cells 1 to 5 days after implantation with saline or UBM in mice. (E) Histologic and macroscopic appearance of B16–F10 tumors at a similar external size (200 mm3) with saline or UBM implantation [hematoxylin and eosin (H&E) stain; 50x mosaic images left; 200x bottom right]. Tumors are denoted by arrowheads (50x mosaics) and the “Tu” label (200x images). UBM particles are enclosed by a dashed line and the “UBM” label. (F) Immunofluorescence staining for CD3+ T cells (red) and B220+ B cells (green) with 4′,6-diamidino-2-phenylindole (DAPI) counterstain (blue) after 7 days. (n = 3 animals; 200x). (G) CD4 (green) and CD3 (red) T cell costaining within the UBM microenvironment after 7 days (200x). (H) Flow cytometry quantifying the proportions of CD4+ and CD8+ T cells after 7 days (n = 5, means ± SE). (I) Flow cytometry of FoxP3 expression in tumor CD4+ T cells [and UBM fluorescence minus one (FMO)/isotype control], quantified (J) in tumors and tumor draining lymph nodes (DLNs) 7 days after injection (n = 5, means ± SE). (K) B16–F10 tumor growth and survival in wild-type (WT), Rag1−/−, and CD4+ T cell repopulated Rag1−/− mice with UBM or saline delivery (n = 5, means ± SE). Flow cytometry: *P < 0.05, ***P < 0.001, ****P < 0.0001, Student’s t test (saline versus UBM). Tumor volume: *P < 0.05 (WT saline versus WT UBM), †P < 0.05 (Rag1−/− UBM versus Rag1−/− + CD4 UBM), two-way repeated measures analysis of variance (ANOVA) with post hoc Tukey test at each time point before sacrifice. Survival: *P < 0.05, log-rank test of each group compared to WT saline with the Sidak correction (significance indicators in legend).

