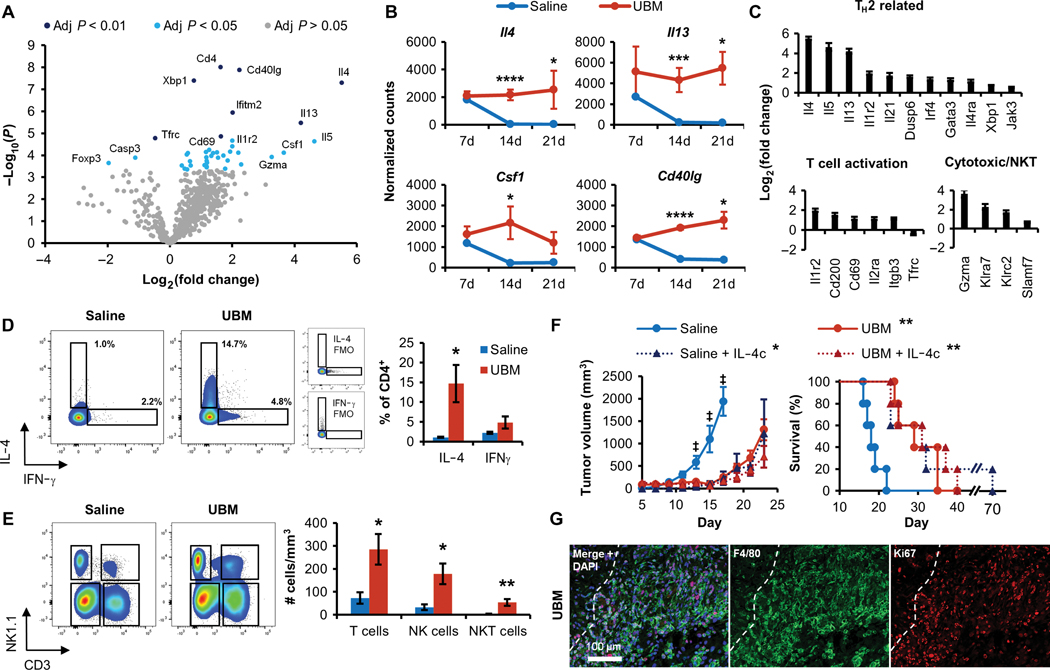
Fig. 2. T cells isolated from the UBM B16-F10 tumor microenvironment have an activated T H2 and myeloid-regulating phenotype.
T cells were sorted from UBM or saline-delivered B16–F10 tumors for multiplex gene expression analysis using the NanoString platform. (A) Volcano plot of genes differentially regulated in UBM- associated T cells compared to saline 14 days after injection. Significantly different regulation was determined from false discovery rate-adjusted P values. (B) Normalized counts of TH2-associated (Il4 and Il13) and myeloid-regulating (Csf1 and Cd40lg) gene transcripts between 7 and 21 days after injection (n = 3 to 4 except 7-day saline pooled from three animals, means ± SD). (C) Differential expression of TH2-related, T cell activation, and cytotoxic gene sets in UBM relative to saline 14 days after injection. (D) Intracellular cytokine staining of IL-4 and IFN-γ in CD4+ T cells from saline and UBM B16-F10 tumors 14 days after injection compared to FMO controls (n = 5, means ± SE). (E) T cell (CD3+NK1.1−), NKT cell (CD3+NK1.1+), and NK cell (CD3−NK1.1+) density in tumors and implants (cells/mm3) 14 days after injection (n = 5, means ± SE). (F) Effect of exogenous IL-4c codelivery with saline or UBM on B16–F10 tumor formation and survival (10 mg of IL-4c per injection; n = 5, means ± SE). (G) Immunofluorescence histology of F4/80+ macrophages (green) and the nuclear proliferation marker Ki67 (red) in the UBM microenvironment after 7 days with DAPI counterstain (200x; dashed line indicates UBM implant border). Flow cytometry and gene transcript counts: *P < 0.05, **P < 0.01, ***P < 0.001, ****P < 0.0001, Student’s t test (saline versus UBM). Tumor volume: +P < 0.05 (saline versus UBM, saline + IL-4c, and UBM + IL-4c), two-way repeated measures ANOVA with post hoc Tukey test at each time point before sacrifice. Survival: *P < 0.05, **P < 0.01, log-rank test compared to WT saline with the Sidak correction (significance indicators in legend).

