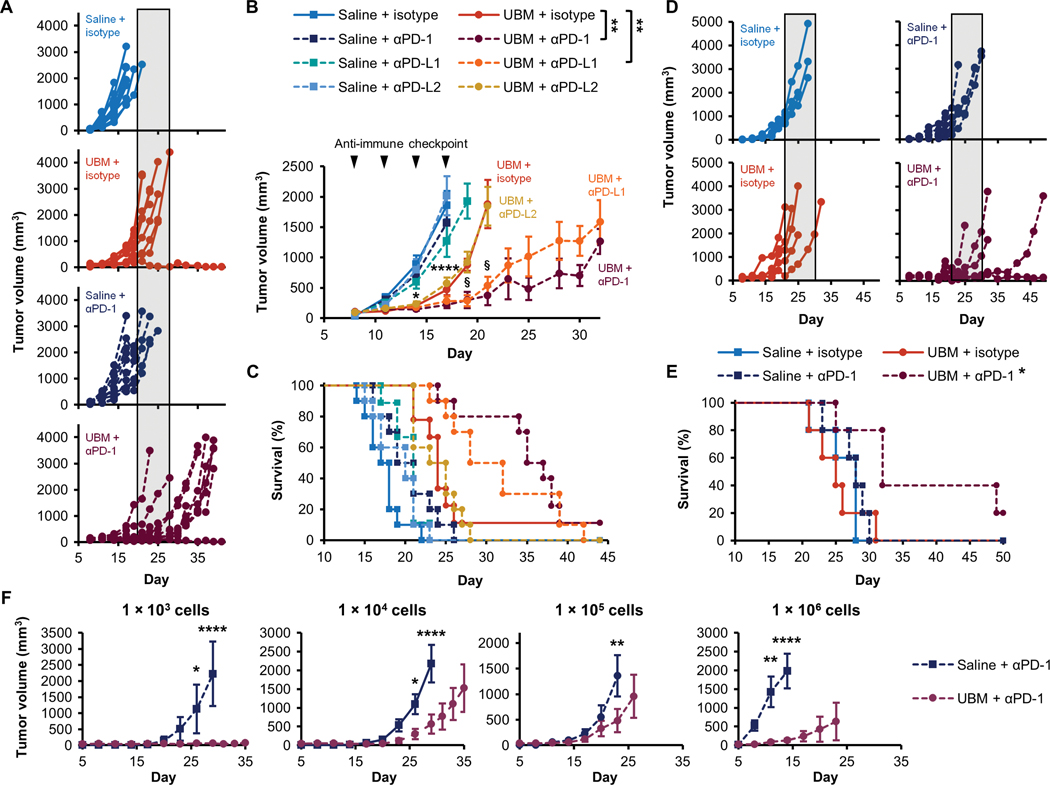
Fig. 5. Synergistic tumor inhibition with UBM and immune checkpoint blockade immunotherapy.
B16–F10 delivery with saline or UBM was followed by treatment with monoclonal antibodies blocking PD-1, PD-L1, PD-L2, or isotype controls. (A) Individual tumor growth curves comparing the effect of anti-PD-1 treatment in the UBM microenvironment compared to saline (shaded region indicates the time range of terminal tumor growth in the UBM and isotype group). (B) Average tumor volume and (C) survival for treatments noted in (A) (n = 8 to 10, means ± SE). Arrowheads indicate treatment frequency. (D) Tumor volume when UBM or saline was delivered 1 day after B16-F10 cells, followed by anti-PD-1 treatment or isotype controls 4 days later. (E) Survival for delayed UBM implantation with anti-PD-1 treatment as noted in (D) (n = 5). (F) B16-F10 cell titration in the UBM microenvironment with anti-PD-1 treatment compared to saline (n = 5, means ± SE). Initial B16–F10 cell doses range between 1 × 10³ and 1 × 10⁶ cells per injection. Tumor volume: §P < 0.05 (UBM + isotype versus UBM + PD-1 or PD-L1), ****p < 0.0001 (all UBM treatments versus saline + isotype). For cell titration, ****p < 0.01 (UBM versus saline). Two-way repeated measures ANOVA with post hoc Tukey test at each time point before sacrifice. Survival: *P < 0.05, **P < 0.01, log-rank test with the Sidak correction.

