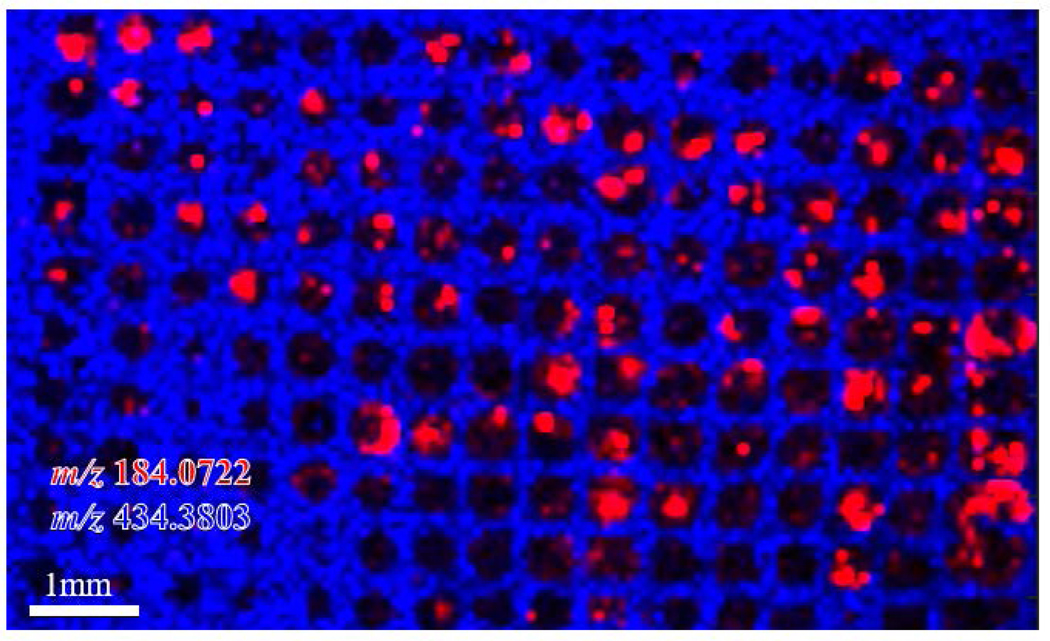
Figure 5. 200μm Microwell Organoid Microarray:
m/z 184.0722, a phosphatidyl choline head group, is shown in red to demonstrate the location of the small pancreatic cancer organoids. m/z 434.3803, shown in blue, is a background signal from gelatin microarray only. This overlay analysis of the organoids and the microarray demonstrates that organoids are aligned on similar z-axis for sectioning and hundreds of organoids can be imaged in a microarray by MSI.

