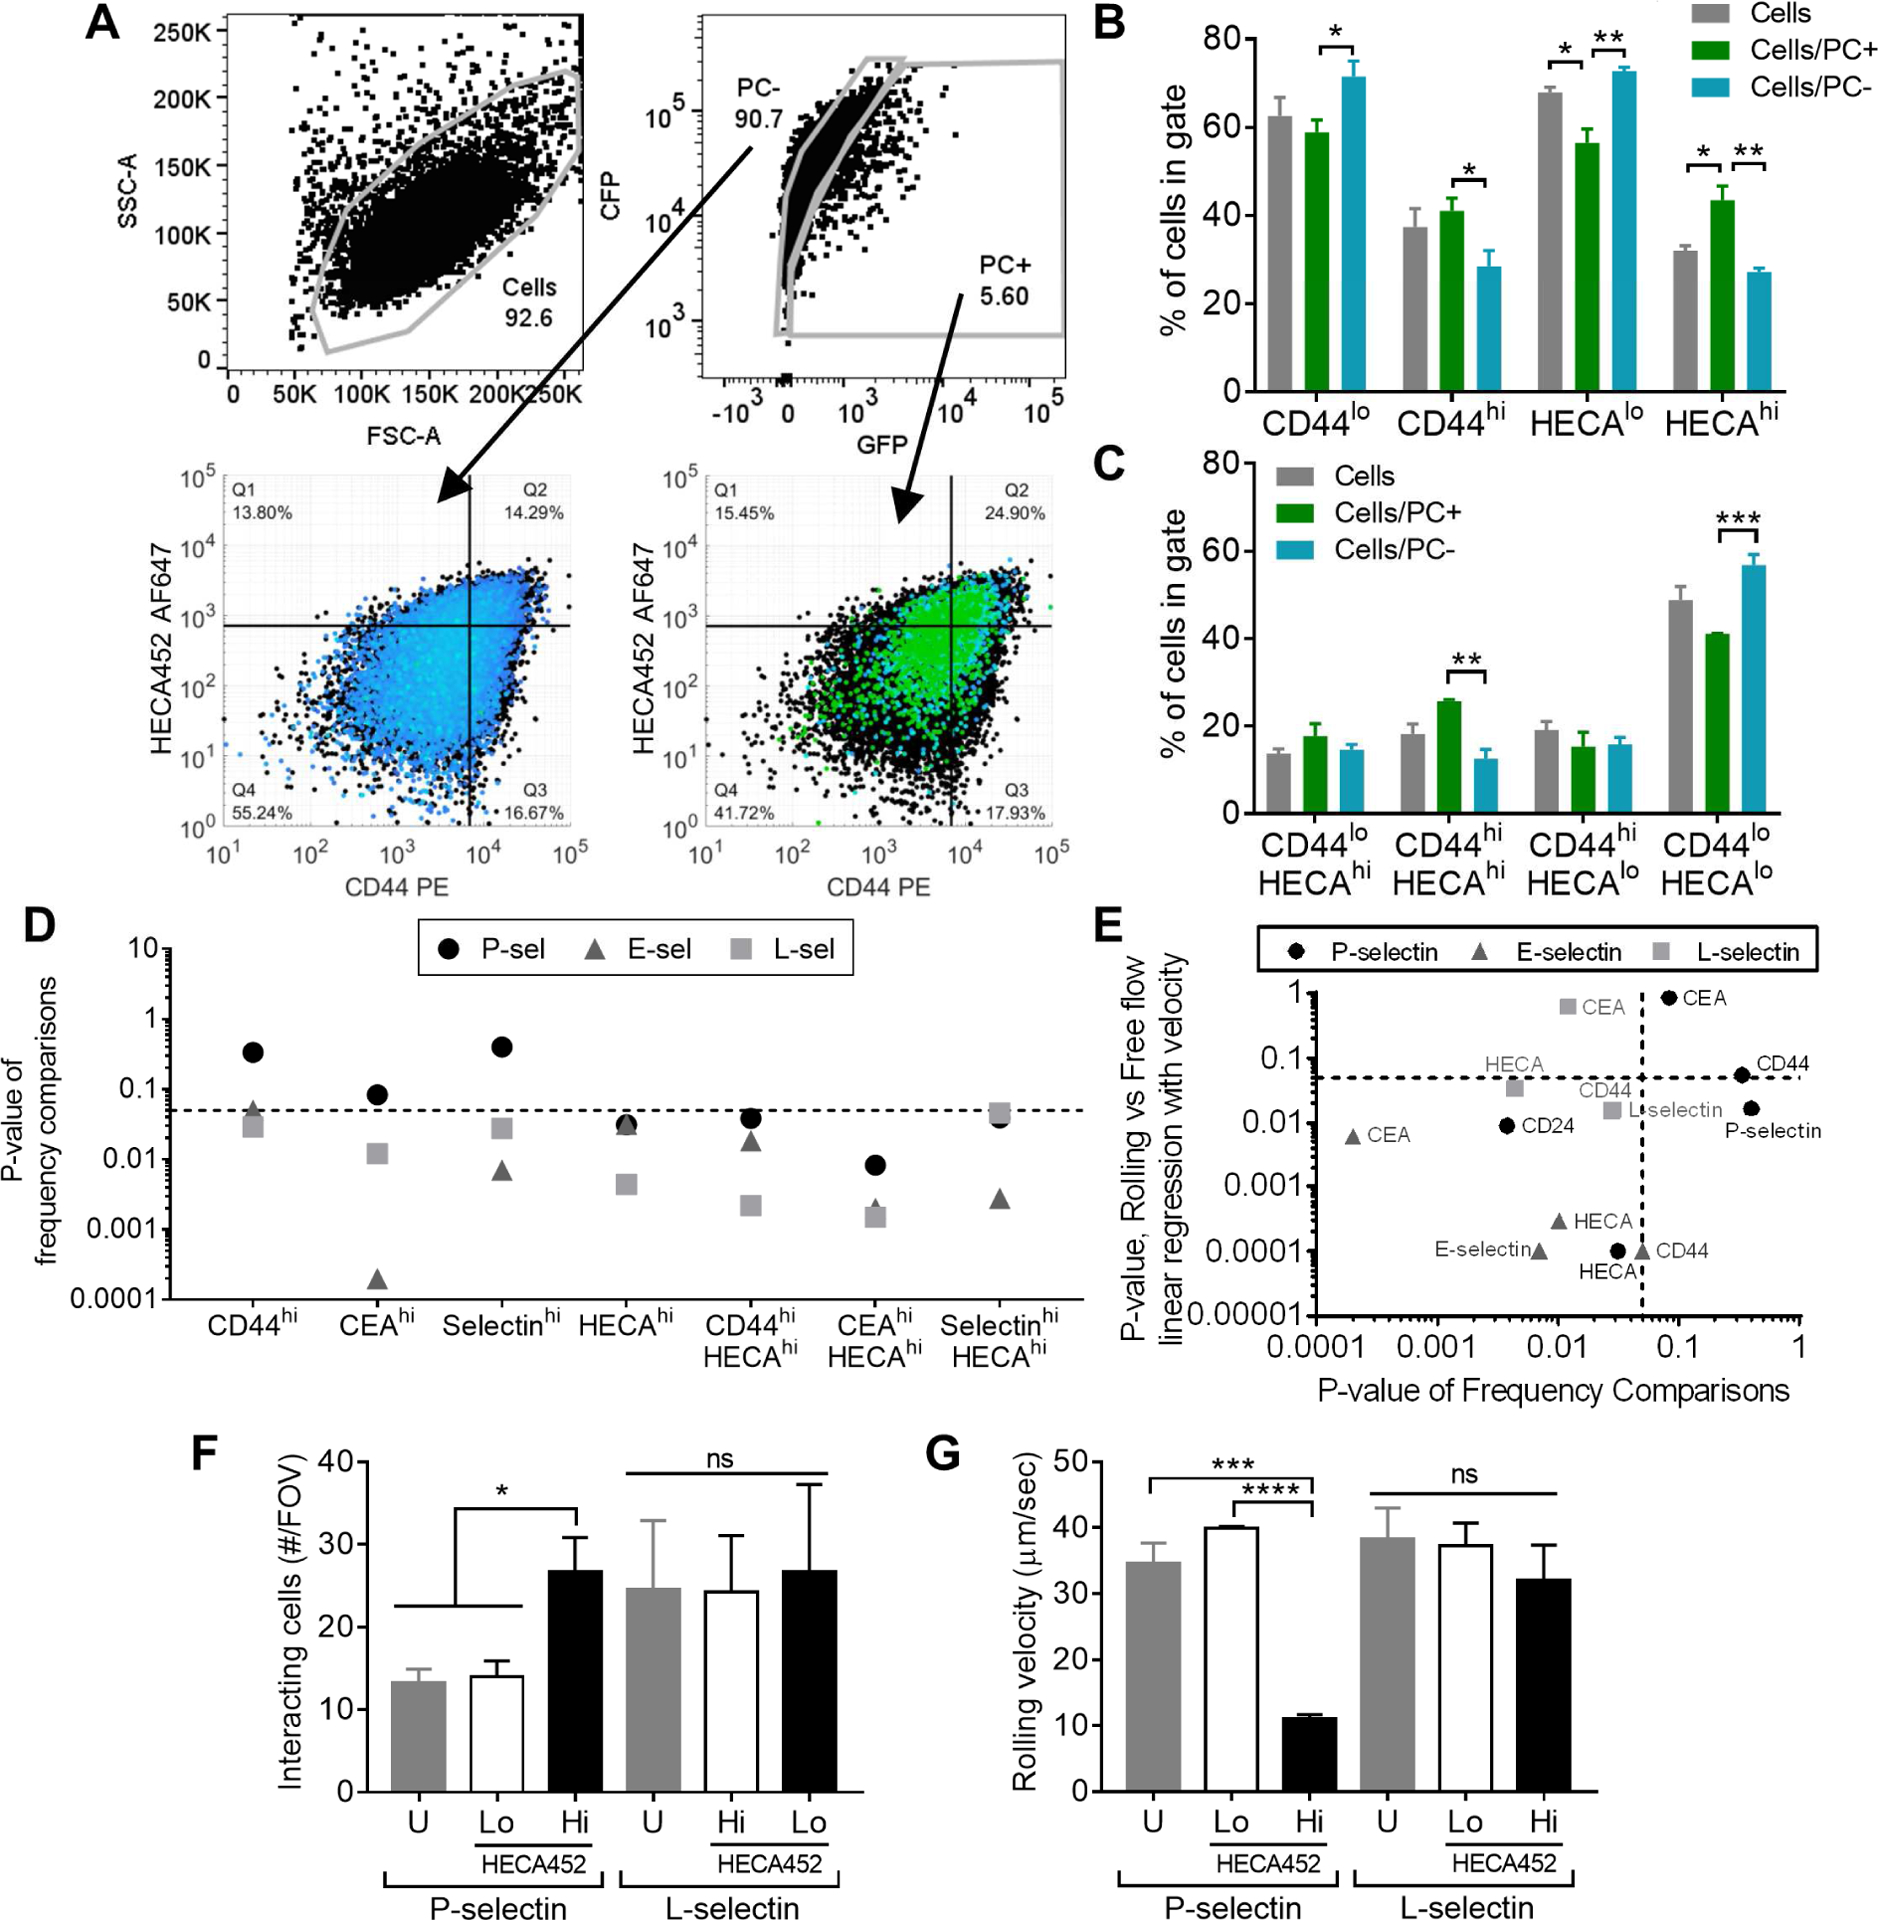
Figure 6). Selectin ligand glycoprotein expression alone increases Phamret-expressing LS174T cell rolling adhesion on E- and L-selectin, and, in combination with high levels of sLex, increases rolling adhesion on P-selectin.

(A-C) Representative flow cytometry gating and analysis strategy. Data from Phamret-expressing LS174T (Phamret LS174T) cells perfused over 25 μg/mL L-selectin at 0.5 dyn/cm2 under exposure to 405 nm light. Total cell population indicated in black. Example comparisons between frequencies of cells in low versus high selectin ligand expression quadrants derived from single stain gating (B) or co-staining (C and depicted in lower panels of A). Frequencies are reported as a percent of parent population (i.e. percent of PC+ cells in the HECA452hi gate is significantly greater than the percent of PC− cells falling within that same gate). Data represent mean ± SEM of independently run experiments. One way ANOVA with post-hoc t-tests and Bonferonni corrections for multiple comparisons between cell populations in each staining group, α=0.05. (D) Compiled p-values from comparison of frequencies of PC+ and PC− Phamret LS174T cells in single and co-staining subgates. (E) Comparison of p-values of linear relationships between the extent of staining and ligand expression to the p-values obtained from comparing frequencies between rolling and free flowing cells in different staining gates. (F-G) Extent (counts from 3 FOVs) of adhesion and rolling velocities (30 cells / FOV in 3 FOVs) on P- versus L-selectin functionalized surfaces of FACS enriched and reperfused HECAhi vs HECAlo LS174T cell subpopulations. U, unsorted stained cells. Data represent mean ± SEM of counts from 3 FOVs from independently run experiments (F) or of pooled rolling velocities of 30 cells / FOV in 3 FOVs from independently run experiments (G), analyzed with a one-way ANOVA with post hoc t-tests with Bonferonni corrections for multiple comparisons between HECA452-sorted groups, α=0.05. See also Figures S4, S6, Table S4.
