
Figure 8.
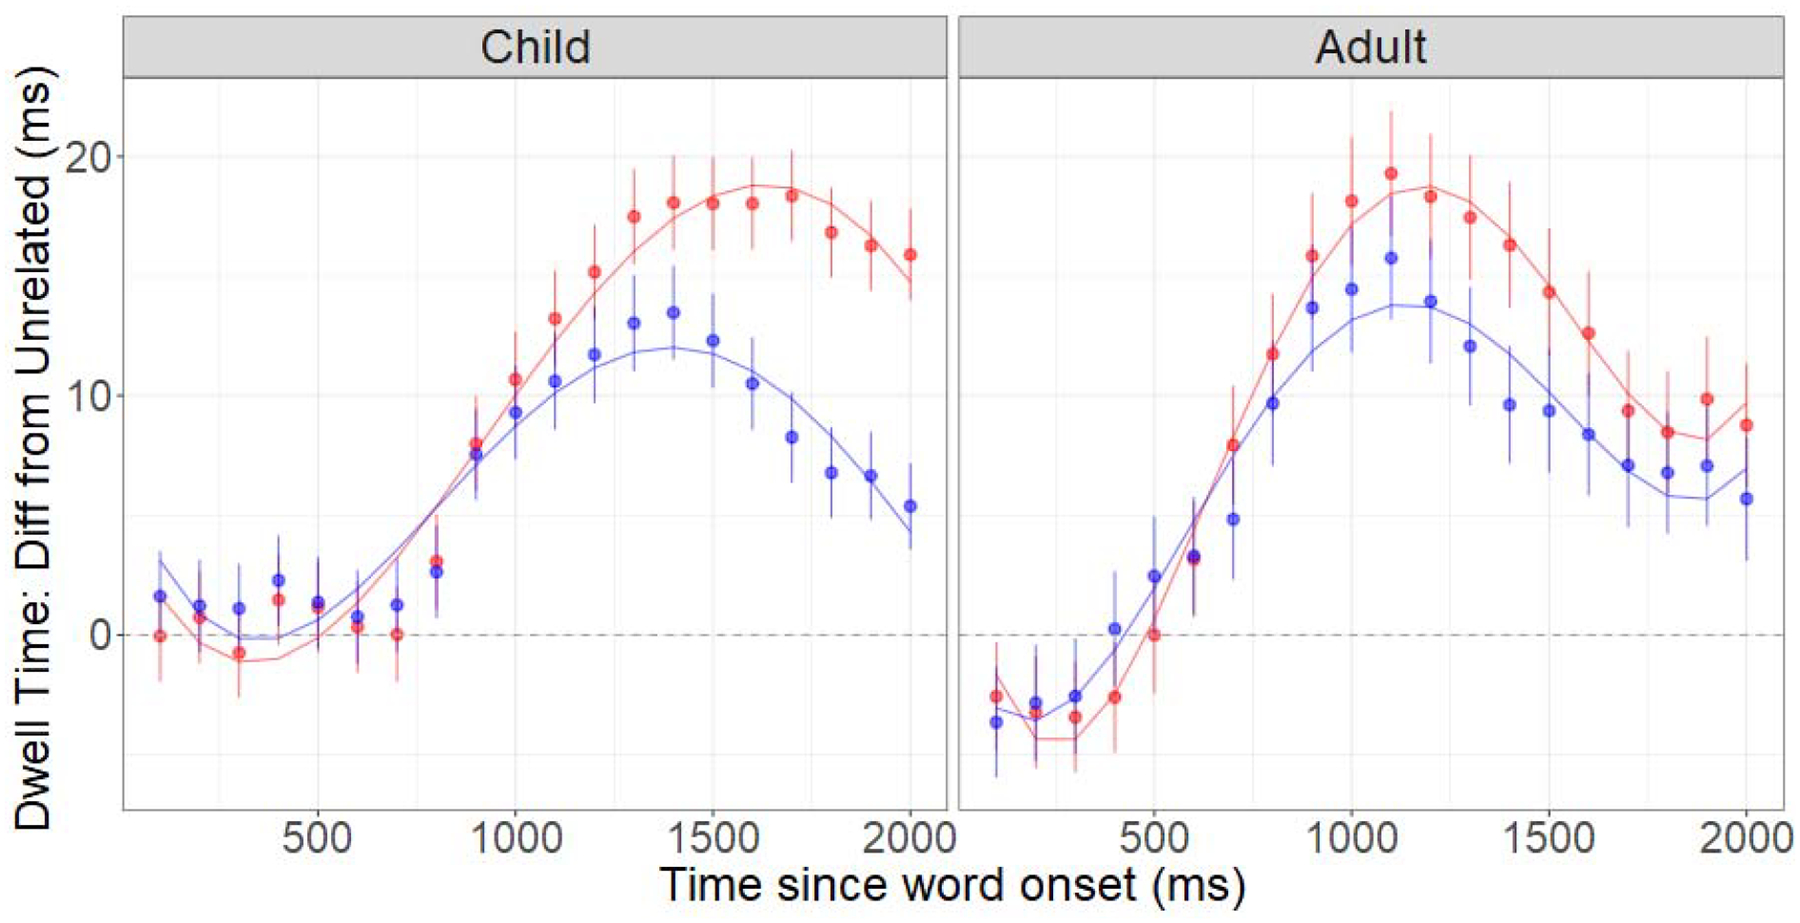
Difference from Unrelated values in the Co-Occur (red) and Taxonomic (blue) conditions in Children and Adults, plotted with lines depicting the fitted values from the models. Error bars depict standard errors of the mean.
Official websites use .gov
A
.gov website belongs to an official
government organization in the United States.
Secure .gov websites use HTTPS
A lock (
) or https:// means you've safely
connected to the .gov website. Share sensitive
information only on official, secure websites.
Difference from Unrelated values in the Co-Occur (red) and Taxonomic (blue) conditions in Children and Adults, plotted with lines depicting the fitted values from the models. Error bars depict standard errors of the mean.