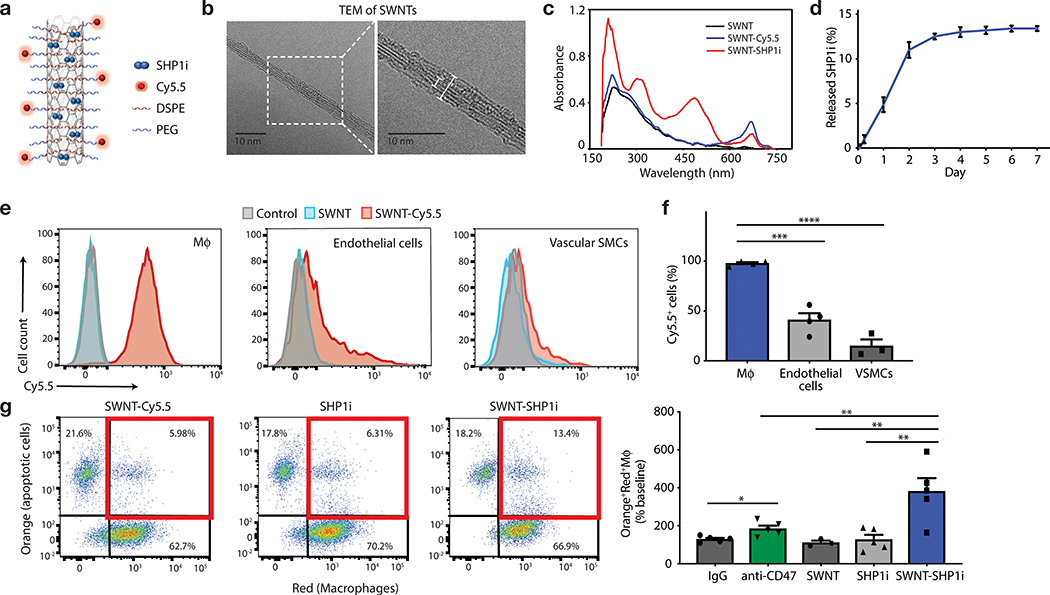
Figure 1: SWNT-SHP1i promotes the phagocytosis of apoptotic cells by macrophages.
a, Schematic of SWNT-SHP1i, comprised of a backbone of single-walled carbon nanotubes (SWNTs) which are functionalized with phospholipid-PEG (DSPE-PEG; 1,2-distearoyl-sn-glycero-3-phosphoethanolamine-N-[amino(polyethylene glycol)]) to form biocompatible nanotubes, Cy5.5 fluorophore for tracking in vivo delivery, and small-molecule inhibitors of SHP-1 (SHP1i) via π-π stacking and hydrophobic interactions with the nanotube surface. b, Negative staining transmission electron micrographs (TEM) show the cylindrical morphology of SWNTs with their surrounding PEG phospholipid layer. Bare SWNTs apparently have a diameter of ~2–3 nm (inner white line). The adsorbed PEG chains result in an increased SWNT diameter to ~5–6 nm (outer white line). c, UV-vis spectrum of SWNTs (black), SWNT-Cy5.5 (blue), and SWNT-SHP1i (red). d, Release curve of SHP1i from SWNT-Cy5.5 in serum, demonstrating controlled release over 7 days (n = 3 biologically independent experiments). e,f, Cellular uptake assays demonstrate the propensity of SWNTs to specifically accumulate in murine macrophages (RAW264.7) compared to endothelial cells and VSMCs (n = minimum 3 biologically independent experiments). Flow cytometry histograms of cells from uptake studies with SWNT-Cy5.5, plain SWNTs (not adorned with Cy5.5), and PBS controls. Mϕ, macrophages (e). ***p = 0.0001, ****p < 0.0001 by one-way ANOVA with a Tukey post-hoc test. g, In vitro phagocytosis assays confirm that SWNT-SHP1i augments the clearance of apoptotic vascular cells by macrophages at least as potently as gold standard anti-CD47 antibodies, compared with SHP1i and SWNT controls (n = 5 biologically independent experiments). *p < 0.05 by unpaired two-tailed t-test. **p < 0.01 by one-way ANOVA with a Tukey post-hoc test. For all graphs, data are expressed as the mean and standard error of the mean (s.e.m.).

