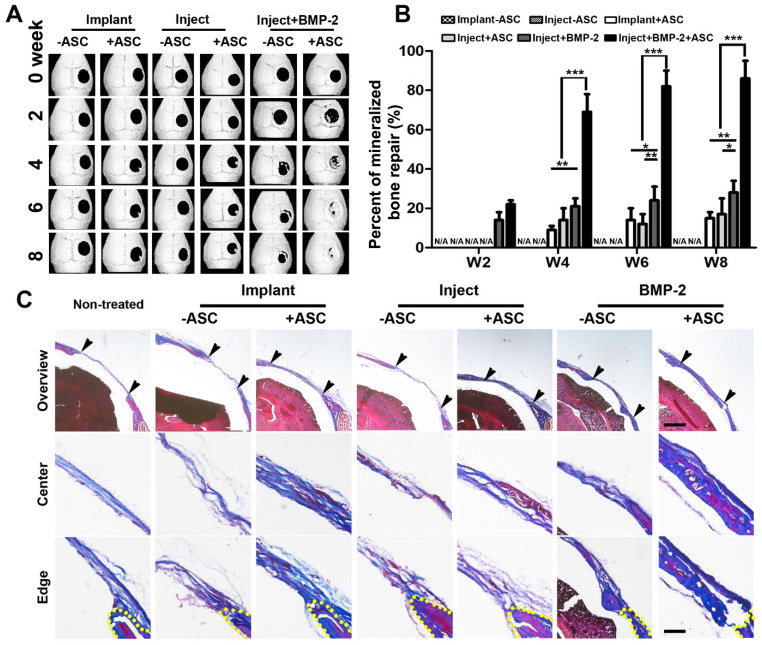
Figure 5.
Micro-CT imaging of cranial defect mice across different time points and histological cross sections of mouse cranial defects at week 8. (A). Representative micro-CT images of cranial defect mice treated with injected and implanted μRB scaffolds, and BMP-2 incorporated μRB scaffolds, with or without ASCs. (B). Quantification data from (A). Percent of bone healing was normalized to the defect size at week 0. *, p<0.05; **, p<0.01; ***, p<0.001. Data are presented as mean±S.D. N=5 per group. (C). Trichrome staining of the defect center and edge of cranial defect mice treated with injected and implanted μRB scaffolds, and BMP-2 incorporated μRB scaffolds, with or without ASCs, Bar=1mm (first row) and 200 μm (middle and last row).

