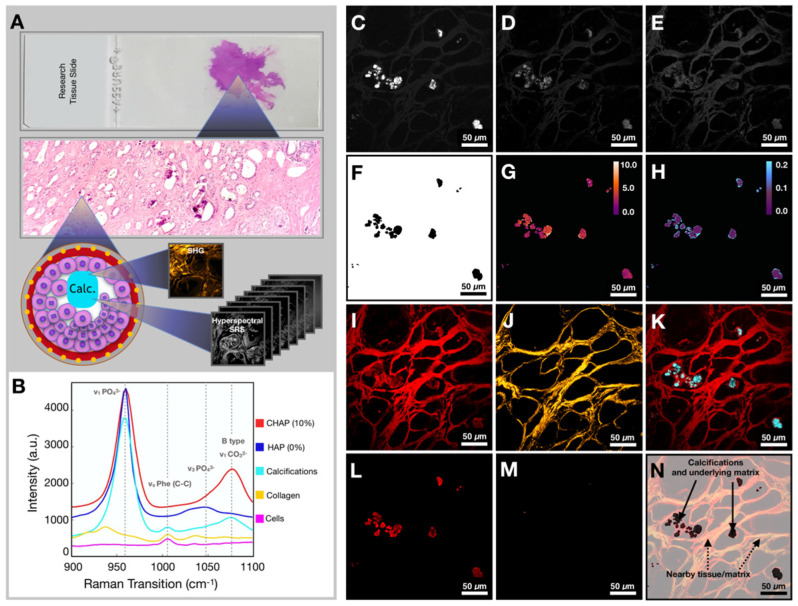
Figure 3.
Workflow for tissue imaging and image processing. A) Diagram depicting imaging of the field of view to yield hyperspectral SRS and SHG information. B) Spectra of controls (CHAP and HAP) and spectra from various components encountered in breast tissue (calcifications, collagen, and ductal cells). C) Image at phosphate transition (~960 cm-1). D) Image at carbonate Raman transition (~1070 cm-1). E) Image at phenylalanine Raman transition (~1005 cm-1). F) Phosphate image-based mask used to isolate calcifications only. G) Carbonate content % map (mask applied). H) Phenylalanine to phosphate ratio map (mask applied). I) Image at CH Raman transition (~2930 cm-1). J) SHG image. K) Composite of CH (red) and phosphate (cyan) images. L) CH Image (mask applied). M) SHG image (mask applied). N) Diagram depicting nomenclature used in the manuscript.

