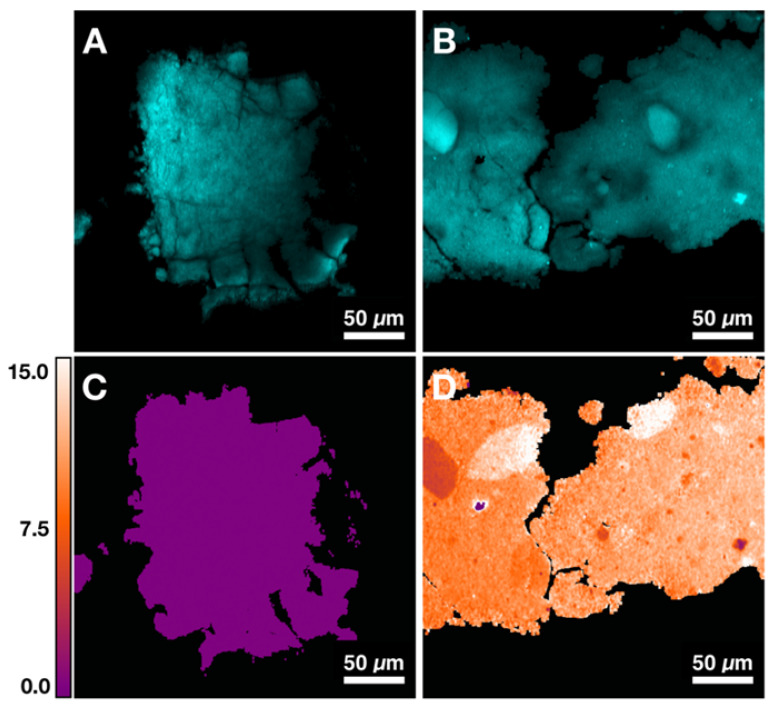
Figure 4.
Quantification of carbonate content in hydroxyapatite (HAP) based on control samples. A) Image at phosphate Raman transition (960 cm-1) for pure HAP. B) Image at phosphate Raman transition (960 cm-1) for 10% carbonated hydroxyapatite (CHAP). C) Carbonate content map for HAP. D) Carbonate content map for 10% CHAP.

