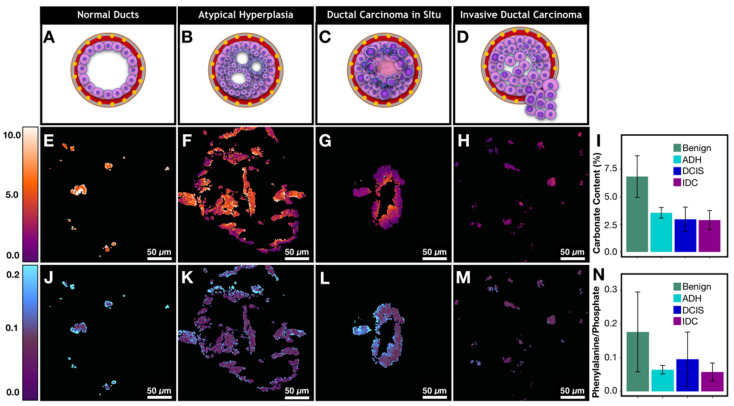
Figure 6.
Metabolic changes associated with cancer affects calcification composition. A)-D) Graphic depiction of neoplastic progression from normal duct to invasive ductal carcinoma. E)-H) Carbonate content changes with neoplastic progression. I) Bar graph demonstrating averages for carbonate content across pathological categories. J)-M) Phenylalanine to phosphate ratio changes with neoplastic progression. N) Bar graph demonstrating averages for phenylalanine to phosphate ratio across pathological categories.

