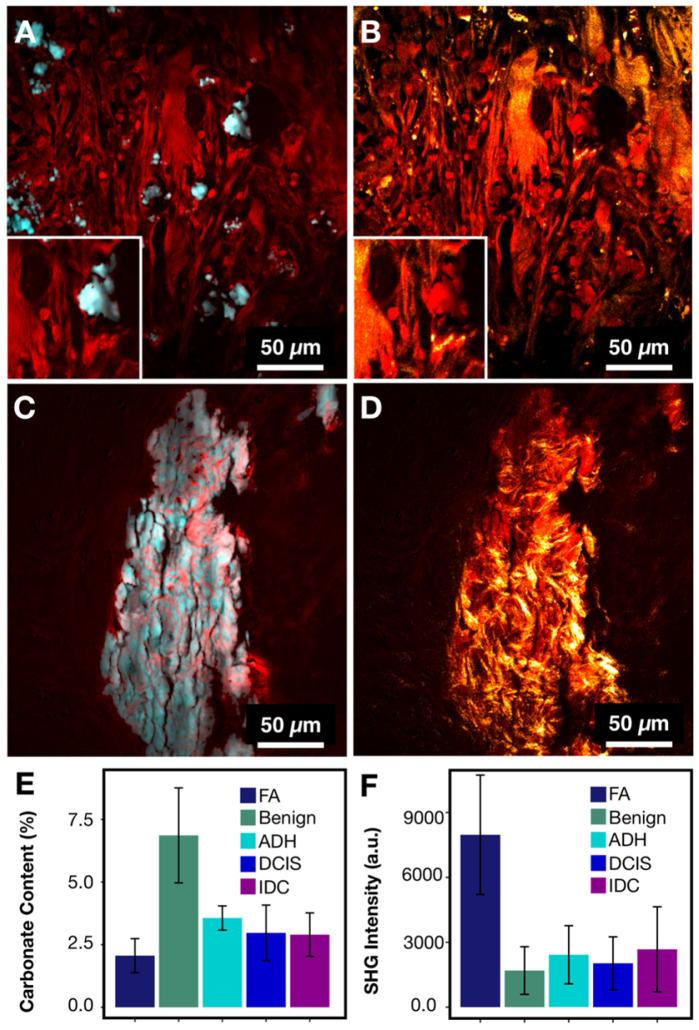
Figure 7.
FA and IDC similarity and differences. A) IDC with protein (red) highlighting calcification underlying matrix along with stroma and phosphate (cyan) highlighting hydroxyapatite. B) IDC composite of protein (red) and SHG (gold) highlighting collagen. C) FA with protein (red) highlighting calcification underlying matrix along with stroma and phosphate (cyan) highlighting hydroxyapatite. D) FA composite of protein (red) and SHG (gold) highlighting collagen. E) Bar chart for carbonate content across all categories. F) Bar chart for SHG intensity across all categories.

