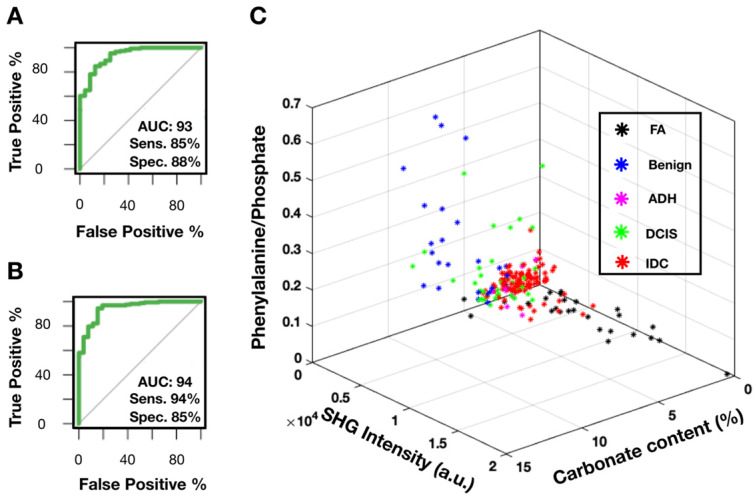
Figure 8.
SRS and SHG imaging data statistical analysis. A) ROC curve for carbonate content as a parameter when differentiating benign and neoplastic cases. B) ROC curve for SHG intensity as a parameter when differentiating FA and IDC cases. C) Scatter plot depicting separation of cases across all diagnostic categories.

