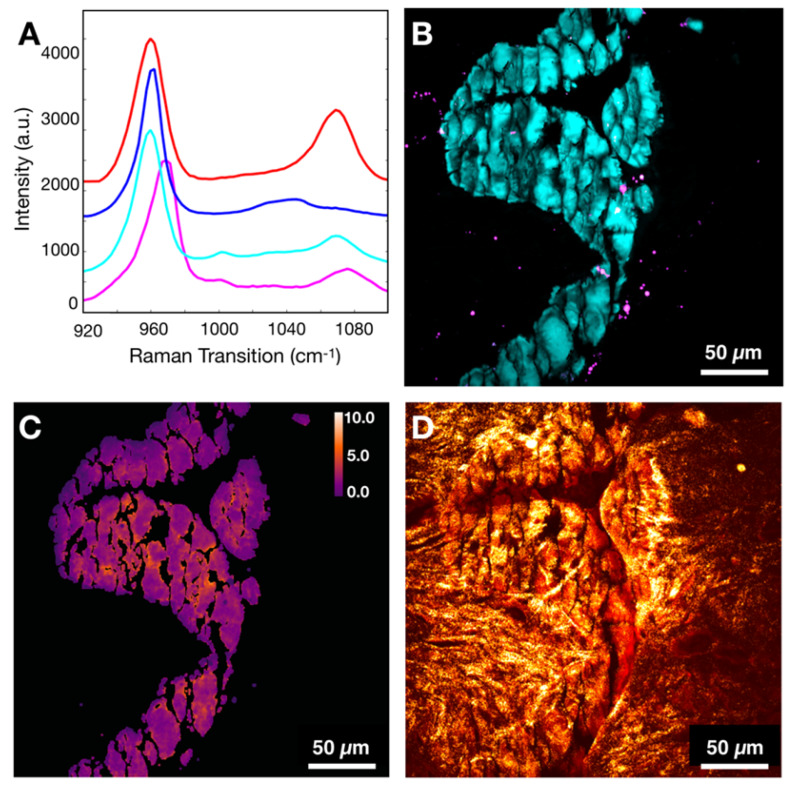
Figure 9.
Evaluation of whitlockite contribution to dominant mineral species HAP/CHAP. A) Spectral differences of CHAP (red), HAP (blue), FA associated CHAP/HAP (cyan), and whitlockite (magenta). B) Depiction of spatial distribution of HAP/CHAP highlighted using phosphate (cyan) and whitlockite highlighted using red-shifted phosphate (magenta). C) Carbonate content map for the same FOV. D) Calcification underlying organic matrix and stroma depicted using CH Raman transition (red), and SHG (gold).

