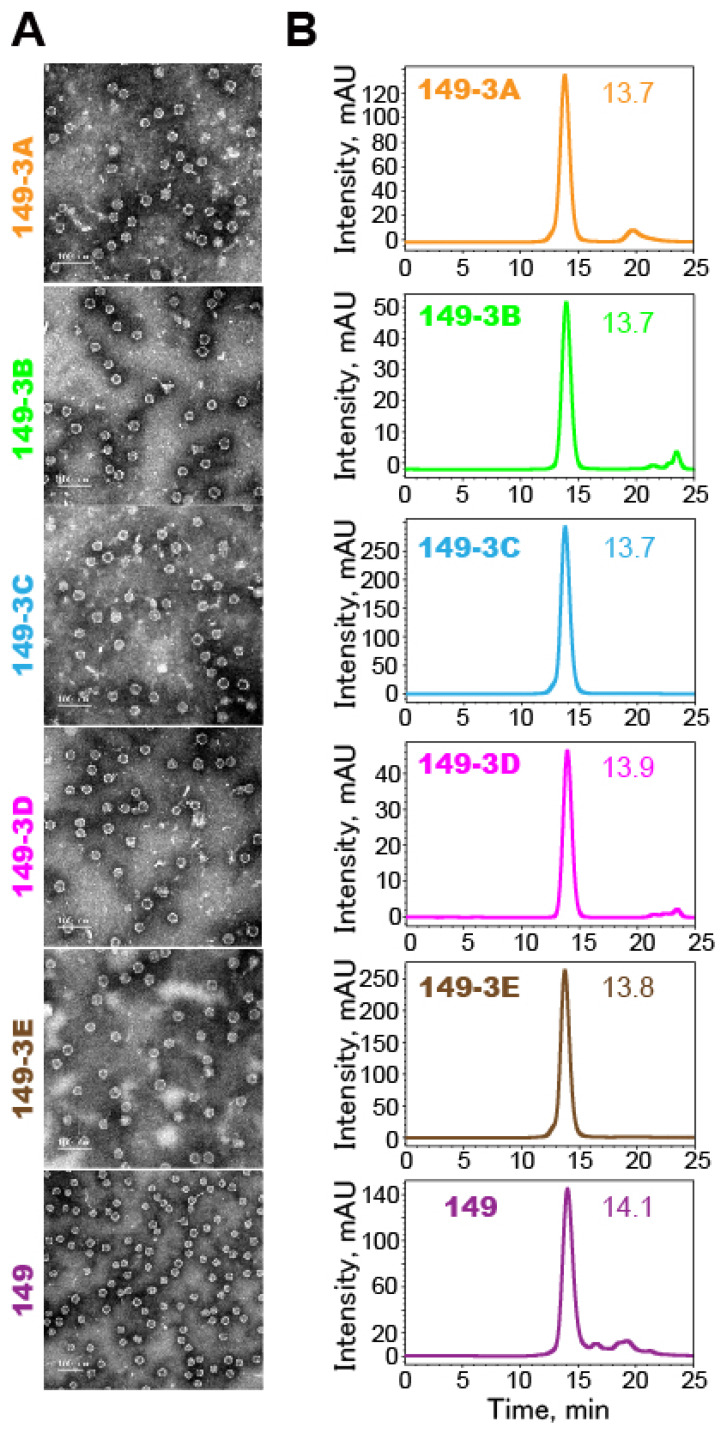
Fig 3.
Characterization of self-assembly of the fusion proteins into VLPs. (A) TEM images of suspensions of VLPs (magnification: 25,000x). Scale bars represent 100 nm. (B) Analysis of VLPs by HPSEC. Elution profiles (arbitrary units over time) show that all preparations are highly homogenous. The peak elution time is indicated.

