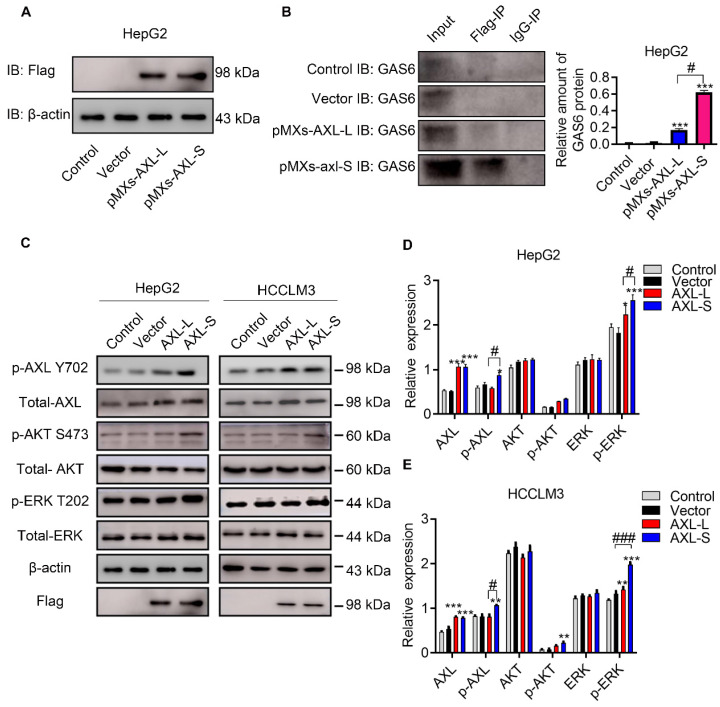
Figure 2.
Axl-S isoform has a more robust binding ability to Gas6 ligands. (A) Western-blot was used to detect the over-expression of Axl-L and Axl-S isoforms in HepG2 cells. (B) Left: Co-IP assay was used to detect the binding ability of Axl-L and Axl-S isoforms to Gas6 ligands; right: The relative amount of Gas6 protein bound in HepG2 cells over-expressing Axl-L or Axl-S. Data were analyzed using Student's T-test. The control levels were set to a value of 1. Data are presented as mean ± S.D. (N=3). The “***” indicates “P<0.001” versus the pMXs-Axl-L group. (C) The effect of Axl-L and Axl-S over-expression on Axl and downstream AKT and ERK signaling pathway proteins was detected by Western-blot. Statistical analysis of the effects of over-expression of Axl isoforms on AKT and ERK signaling pathway proteins in HepG2 cells (D) and HCCLM3 cells (E). The relative expression of p-Axl represents the relative expression of p-Axl to Axl. The relative expression of p-AKT represents the relative expression of p-AKT to total Axl. The relative expression of p-ERK represents the relative expression of p-ERK to total ERK. The relative expression of total Axl, AKT, ERK represents the relative expression of total Axl, AKT, ERK to β-actin. Two-way ANOVA and Tukey's post-hoc test was used to analyze the data. Data are presented as mean ± S.D. (N=3). The “*, **, ***” indicate “P<0.05, 0.01, 0.001” versus the control group, respectively. "#" represents P<0.05, "##" represents P<0.01, and "###" represents P<0.001. “#, ##, ###” indicates statistical difference between over-expressed Axl-L and Axl-S experimental groups.

