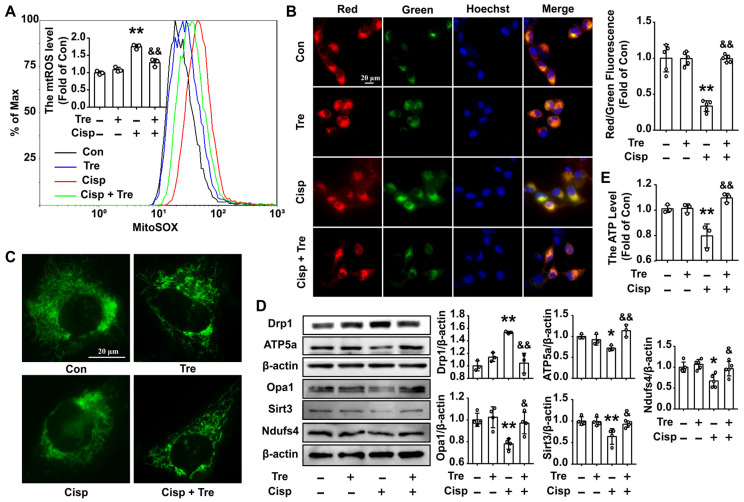
Figure 3.
Trehalose attenuates mitochondrial dysfunction in cisplatin-treated HK2 cells. (A) Mitochondrial ROS (mtROS) were measured by incubation with MitoSOX. (B) The mitochondrial membrane potential measurement was detected with JC-1 and quantified by ImageJ. (C) Representative images of the mitochondrial morphology of HK2 cells stained with MitoTracker Green. (D) The expression of mitochondria-related proteins (Drp1, Opa1, ATP5a, Sirt3 and Ndufs4) was measured by western blotting. (E) ATP levels were quantified in HK2 cells, the ATP content was calculated as nmol/mg of protein, and the data are represented as the rate of control. (cisplatin, 5 μM; trehalose, 50 mM). Data are shown as the means ± s.d. from at least three independent experiments and analyzed by one-way ANOVA with Tukey's test. * P < 0.05, ** P < 0.01 vs. Con; & P < 0.05, && P < 0.01 vs. Cisp. (Con, control; Tre, trehalose; Cisp, cisplatin; Cisp + Tre, cisplatin + trehalose).

