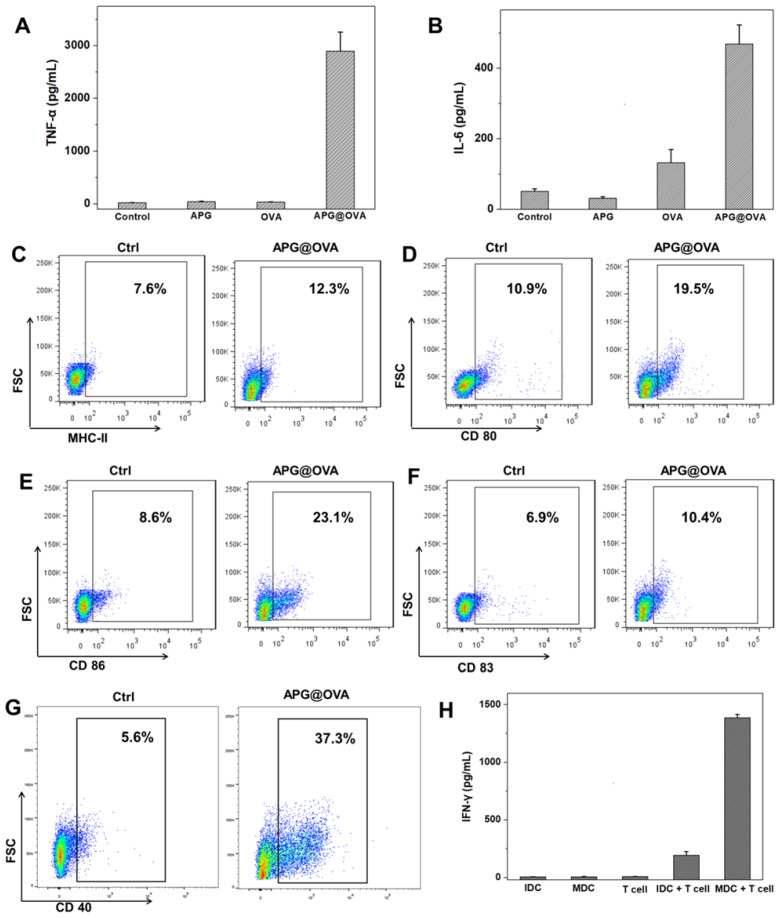
Figure 3.
BMDC activation of APG@OVA NPs and in vitro T cell activation. The concentrations of TNF-α (A) and IL-6 (B) in the BMDC culture supernatants after activation with APG NPs, pure OVA, and APG@OVA NPs. The BMDCs without any treatment were set as control. Error bars indicate mean standard deviations of six parallel samples for each case. (C-G) FACS quantification of the expressions of MHC-II, CD80, CD86, CD83, and CD40. (H) The cytokine IFN-γ secretion from the T cells incubated with different types of treated BMDCs by ELISA. Error bars represent the mean standard deviations of three replicates.

