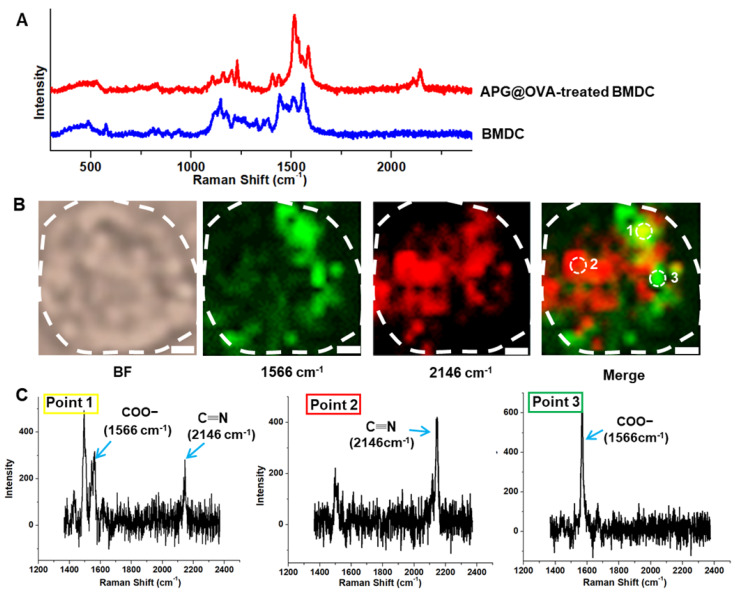
Figure 4.
Raman spectra and imaging of BMDCs. (A) Raman spectra of the single BMDC with or without the treatment of the APG@OVA NPs. (B) Bright-field (BF) and Raman mapping images of the BMDC based on the 1566 and 2146 cm-1 channels and their merged images. Scale bar: 2 μm. (C) Raman spectra of points 1, 2 and 3.

